
 Business
Scores

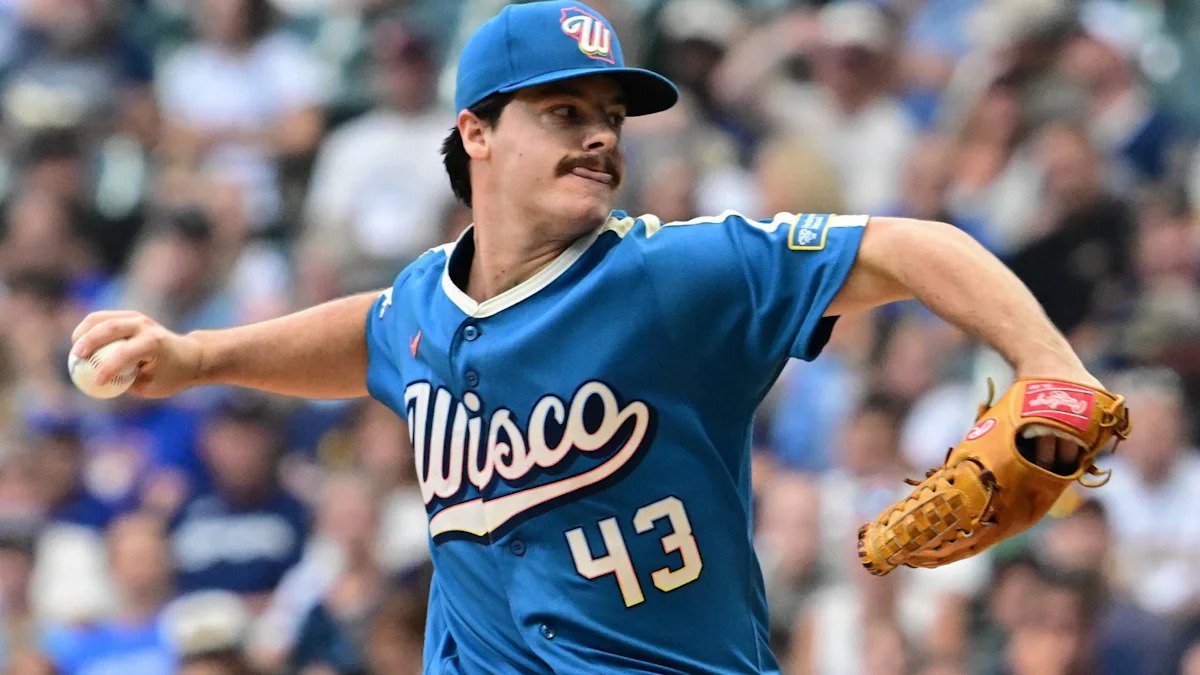
Logan Henderson is lined up for Game 2 of the NLCS with a run-prevention record that extends beyond one postseason outing. Across his first 24 major-league starts, he allowed no more than three runs in a game, whether measured by total runs or earned runs.
The Sporting Page reconciled the official game logs with each start’s pitch feed and box score. The sample covers five regular-season starts in 2025, 18 in 2026 and the October 4 NLDS start against San Diego. All 24 recorded pitch totals match, producing 1,987 pitches for analysis.
Across those starts, Henderson worked 128⅔ innings with 33 earned runs, 147 strikeouts and 30 walks. That produces a 2.31 ERA and 0.878 WHIP in this combined regular-season and postseason sample. It is not a single-season leaderboard statistic.
| Sample | Starts | IP¹ | ER | ERA | WHIP | K / BF | BB / BF |
|---|---|---|---|---|---|---|---|
| 2025 regular | 5 | 25.1 | 5 | 1.78 | 0.987 | 33.3% | 8.1% |
| 2026 regular | 18 | 98.1 | 27 | 2.47 | 0.844 | 29.6% | 5.1% |
| 2026 postseason | 1 | 5.0 | 1 | 1.80 | 1.000 | 18.2% | 13.6% |
¹ Baseball innings notation: .1 is one out and .2 is two outs. ERA and WHIP are calculated using outs.
A larger cutter share accompanies the 2026 sample
Henderson’s four-seam fastball and changeup remained his main pitches. Together they accounted for 88.8% of the 2025 regular-season sample and 81.7% in 2026.
The cutter’s share rose from 7.8% to 15.2%. The feed labels his less-used breaking pitch as a slider in 2025 and a sweeper in 2026. Those labels are kept separate rather than treated as proof that he replaced one pitch with another.
Average four-seam velocity was similar across the two regular seasons: 92.9 mph in the five-start 2025 sample and 93.1 mph in 2026. The larger change in the tracked results came from the changeup, whose whiff rate increased from 22.4% to 35.9%.
| Pitch | Count | Mix | Avg. mph | Swings | Misses | Miss / swing |
|---|---|---|---|---|---|---|
| Four-Seam Fastball | 200 | 48.8% | 92.9 | 113 | 25 | 22.1% |
| Changeup | 164 | 40.0% | 81.8 | 85 | 19 | 22.4% |
| Cutter | 32 | 7.8% | 87.6 | 18 | 5 | 27.8% |
| Slider | 14 | 3.4% | 83.3 | 8 | 1 | 12.5% |
| Pitch | Count | Mix | Avg. mph | Swings | Misses | Miss / swing |
|---|---|---|---|---|---|---|
| Four-Seam Fastball | 699 | 46.5% | 93.1 | 378 | 62 | 16.4% |
| Changeup | 530 | 35.2% | 82.9 | 281 | 101 | 35.9% |
| Cutter | 229 | 15.2% | 87.8 | 116 | 20 | 17.2% |
| Sweeper | 47 | 3.1% | 81.1 | 21 | 3 | 14.3% |
| Pitch | Count | Mix | Avg. mph | Swings | Misses | Miss / swing |
|---|---|---|---|---|---|---|
| Four-Seam Fastball | 34 | 47.2% | 94.4 | 15 | 2 | 13.3% |
| Changeup | 29 | 40.3% | 84.2 | 15 | 7 | 46.7% |
| Cutter | 6 | 8.3% | 88.2 | 3 | 0 | 0.0% |
| Sweeper | 3 | 4.2% | 81.9 | 1 | 0 | 0.0% |
That changeup comparison is based on 85 swings in 2025 and 281 in 2026. The second sample is more informative, but neither controls for the hitters faced or the counts in which the pitch was used.
The fastball’s whiff rate declined from 22.1% to 16.4% over the same periods. The overall performance should therefore be evaluated as a repertoire, rather than credited to faster or more dominant four-seamers.
Control supports the run-prevention record
Henderson walked 8.1% of the batters he faced in his 2025 regular-season starts and 5.1% in 2026. His strikeout rate moved from 33.3% to 29.6%. The lower walk rate is a useful companion to his 2.47 ERA in the 18-start 2026 sample.
The three-run ceiling still needs context. His April 4 start lasted only two innings, and the innings column in the start log varies considerably. Allowing three or fewer runs does not mean every appearance supplied six innings or met the definition of a quality start.
The postseason outing is a separate test
Against San Diego on October 4, Henderson allowed two runs, one earned, in five innings. He surrendered two hits, walked three and struck out four on 72 pitches.
His fastball averaged 94.4 mph in that start. The changeup generated seven misses on 15 swings. Those measurements describe one game; they are not added to the regular-season comparison to imply a sustained velocity or whiff-rate increase.
The record supports confidence in Henderson’s ability to limit runs and avoid excessive walks across his early career. It does not provide a matchup-specific projection against Los Angeles. A longer sample will be needed to decide which of these pitch-level patterns persists.
Method, full 24-start log and pitch-data download
The sample ends October 4, 2026. The MLB game logs identify 23 regular-season starts and one postseason start. Every feed pitch count matches both the game log and box score; all 1,987 pitch events have a type and measured start velocity.
Pitch shares use all recorded pitches in the named sample. Miss rate uses swinging strikes, including blocked swinging strikes, divided by swings; fouls, foul tips and balls put in play count as swings, with foul tips excluded from misses and bunt attempts excluded from the denominator. These are the definitions used in this study, rather than an assertion that every public database will report identical rates.
ERA = 27 × earned runs ÷ outs. WHIP = 3 × (hits + walks) ÷ outs. Strikeout and walk rates use batters faced as the denominator. Mixed regular-season and postseason totals are labelled as a career sample. Pitch labels can change between seasons; no causal conclusion is made from that change.
Download all 1,987 pitch records (CSV)
| Date / feed | Opponent | IP | R | ER | H | BB | K | Pitches |
|---|---|---|---|---|---|---|---|---|
| 2025-04-20 | Athletics | 6.0 | 1 | 1 | 3 | 1 | 9 | 83 |
| 2025-05-14 | Cleveland Guardians | 5.0 | 2 | 2 | 4 | 1 | 7 | 72 |
| 2025-05-20 | Baltimore Orioles | 5.0 | 0 | 0 | 2 | 2 | 7 | 90 |
| 2025-05-25 | Pittsburgh Pirates | 5.0 | 1 | 1 | 5 | 2 | 6 | 89 |
| 2025-08-03 | Washington Nationals | 4.1 | 1 | 1 | 3 | 2 | 4 | 76 |
| 2026-04-04 | Kansas City Royals | 2.0 | 2 | 2 | 3 | 1 | 3 | 35 |
| 2026-05-03 | Washington Nationals | 6.0 | 2 | 2 | 3 | 0 | 8 | 76 |
| 2026-05-10 | New York Yankees | 5.0 | 2 | 2 | 4 | 1 | 5 | 74 |
| 2026-05-16 | Minnesota Twins | 5.0 | 1 | 1 | 6 | 1 | 7 | 84 |
| 2026-05-22 | Los Angeles Dodgers | 5.0 | 0 | 0 | 2 | 3 | 7 | 85 |
| 2026-07-09 | St. Louis Cardinals | 5.1 | 3 | 3 | 3 | 1 | 4 | 76 |
| 2026-07-17 | Miami Marlins | 5.0 | 1 | 1 | 3 | 0 | 4 | 73 |
| 2026-07-22 | New York Mets | 5.0 | 2 | 2 | 5 | 0 | 9 | 80 |
| 2026-07-28 | San Francisco Giants | 5.2 | 0 | 0 | 2 | 2 | 7 | 93 |
| 2026-08-04 | Pittsburgh Pirates | 6.0 | 2 | 2 | 4 | 1 | 8 | 83 |
| 2026-08-10 | San Diego Padres | 6.1 | 3 | 3 | 5 | 1 | 7 | 91 |
| 2026-08-16 | Los Angeles Dodgers | 7.0 | 1 | 1 | 3 | 1 | 6 | 93 |
| 2026-08-22 | Atlanta Braves | 6.0 | 1 | 1 | 5 | 2 | 4 | 100 |
| 2026-08-28 | Texas Rangers | 7.0 | 1 | 1 | 1 | 0 | 7 | 91 |
| 2026-09-03 | Chicago Cubs | 7.0 | 2 | 2 | 3 | 0 | 7 | 102 |
| 2026-09-09 | Chicago Cubs | 5.0 | 1 | 0 | 2 | 1 | 6 | 95 |
| 2026-09-16 | Pittsburgh Pirates | 5.0 | 3 | 3 | 6 | 1 | 8 | 87 |
| 2026-09-23 | Philadelphia Phillies | 5.0 | 1 | 1 | 4 | 3 | 3 | 87 |
| 2026-10-04 | San Diego Padres | 5.0 | 2 | 1 | 2 | 3 | 4 | 72 |