
MLB · Pitching Data
Peralta’s Changeup Share Matched His Rays Season As Contact Complicated Game 6
The fastball stayed harder than his regular-season average, but eight hard-hit balls qualify his one-run start.
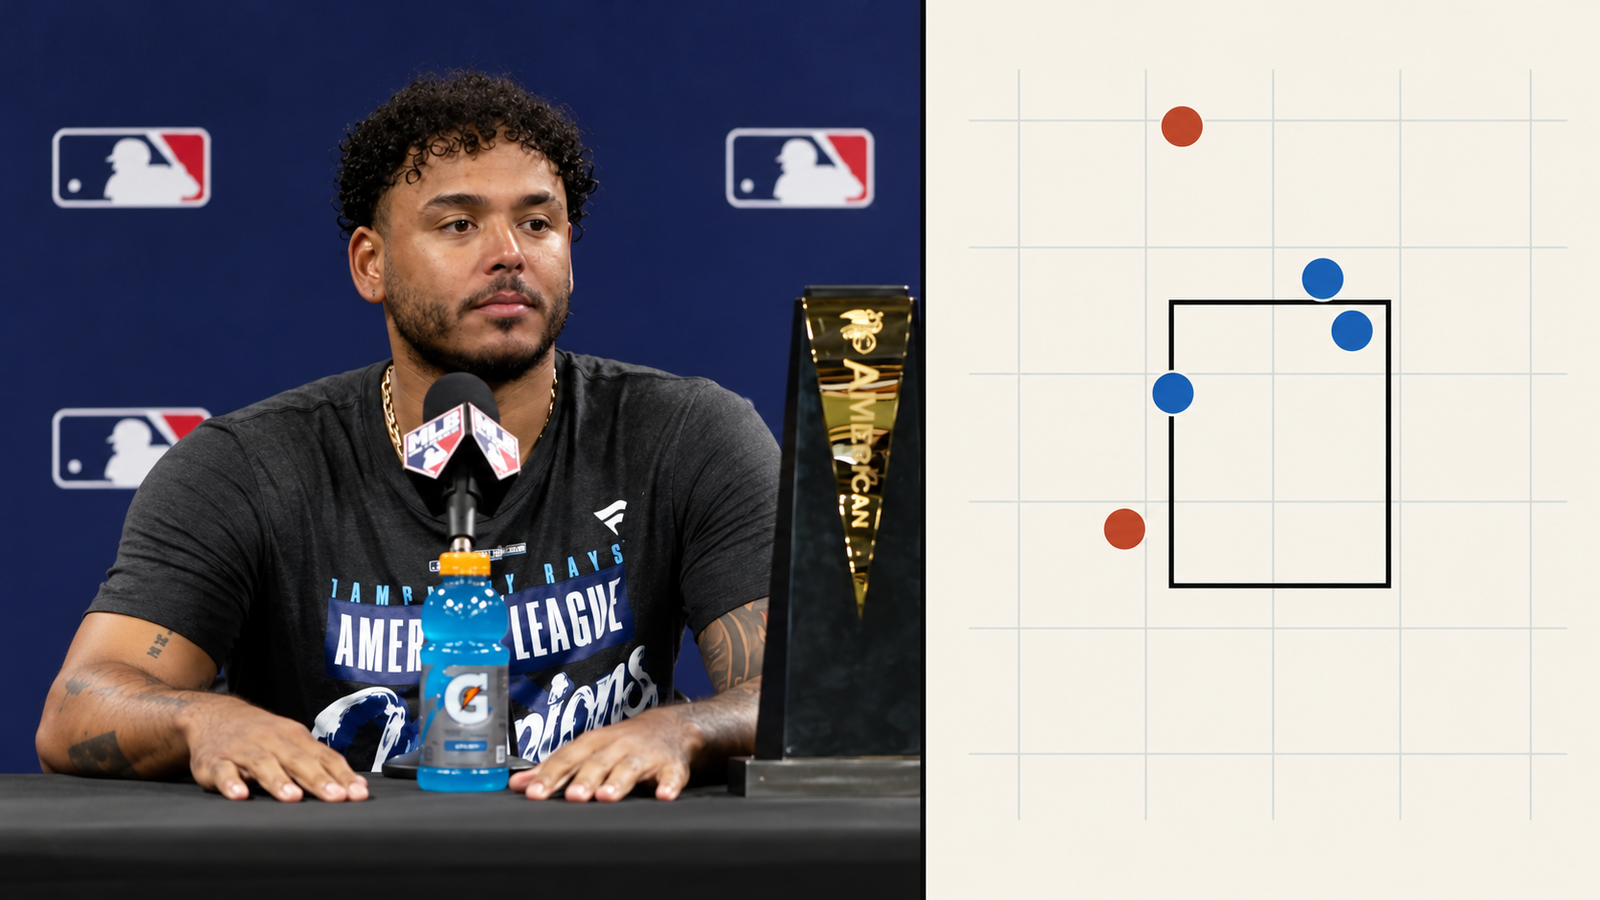
Nathaniel Lowe swung through two Freddy Peralta fastballs in the second inning, then fouled another away. With the count still 1–2, Peralta changed speeds: a 90.0-mph changeup finished outside the recorded horizontal zone boundary and drew the strikeout. Three fastballs had established the two-strike count; a different pitch supplied the out.
That five-pitch confrontation illustrates a Game 6 start in which the changeup occupied more of Peralta’s selection than it had six days earlier. He allowed one run, five hits and three walks over 5⅓ innings at Tropicana Field on October 19, striking out three on 84 pitches. Tampa Bay ultimately beat Cleveland 7–3 to win the American League pennant.
The season comparison makes the apparent adjustment less dramatic. Peralta’s 25 changeups were 29.8% of his physical pitches, above his full-season share but almost identical to his Tampa Bay regular-season usage. His harder fastball remained a postseason characteristic. The complication was contact: Cleveland put 17 balls in play, eight at 95 mph or harder.
A familiar Rays mix, with a harder fastball
The primary baseline contains 2,959 physical pitches from 32 regular-season starts for the Mets and Rays, March 26 through September 25. Changeups accounted for 23.4%. Game 6 increased that share by 6.3 percentage points, while four-seamers rose from 53.0% to 63.1%. Six curveballs supplied the remainder; unused regular-season classifications remain in the denominator.
Peralta changed clubs during the season, so the Rays-only comparison matters. In 866 pitches across 10 Tampa Bay starts, August 4 through September 25, changeups made up 29.7%. Game 6 therefore resembled his established Rays allocation for that pitch. It does not demonstrate that a new changeup emphasis began during this postseason start.
The previous analyzed outing, ALCS Game 2 on October 13, contained 18 changeups among 99 pitches, or 18.2%. Game 6’s increase was 11.6 percentage points relative to that particular start. Those two comparisons answer different questions: he used the pitch more than in Game 2, but roughly as often as during his Tampa Bay regular season.
Cleveland’s lineup also shaped the opportunities. Twenty of his 23 batters faced hit left-handed, accounting for 73 pitches. Against that side, 24 of 73 pitches were changeups, or 32.9%, compared with 26.7% in the full-season baseline. The difference remains within left-handed matchups, although one opponent and one night cannot isolate why he selected each pitch.
The four-seamer averaged 97.1 mph across 53 pitches, against 94.3 mph over the full regular season and 94.8 in his Rays-only sample. His Game 2 average was already 96.9. This was continued postseason velocity rather than a sudden Game 6 jump. The fastball produced nine recorded whiffs in 25 swings and seven called strikes; changeups added five whiffs in 14 swings and two called strikes.
The strikeouts came through three routes. Lowe missed the changeup, Petey Halpin missed a fastball, and Chase DeLauter took a fastball for the third strike after catcher Liam Hicks’s challenge overturned the original call. The ledger preserves that final official ruling. The supporting zone rectangle is a descriptive ball-center test, not a reconstruction of the automated challenge system.
Season repertoire and Game 6
Scale: 0–100%. Gray: regular season. Blue: Game 6.
Four-seam fastball
Change: +10.1 percentage points.
Changeup
Change: +6.3 percentage points.
Curveball
Change: -5.8 percentage points.
Sweeper
Change: -5.7 percentage points.
Slider
Change: -4.0 percentage points.
CS
Change: -0.9 percentage points.
| Type | Pitches | Share | Mean mph | Max mph | Speed n | Whiffs / swings | Called strikes | IVB in | Spin rpm |
|---|---|---|---|---|---|---|---|---|---|
| Four-seam fastball | 53 | 63.1% | 97.1 | 99.0 | 53 | 9/25 | 7 | 18.4 | 2511 |
| Changeup | 25 | 29.8% | 88.9 | 90.9 | 25 | 5/14 | 2 | 4.8 | 2120 |
| Curveball | 6 | 7.1% | 84.2 | 85.5 | 6 | 0/1 | 2 | 1.9 | 2270 |
IVB is induced vertical break relative to a gravity-only trajectory. It does not mean the ball rises. Rates and average measurements describe this appearance.
Nathaniel Lowe: inning 2
Missed bats did not eliminate contact or traffic
Peralta generated 14 recorded whiffs in 40 swing attempts, a 35.0% rate, but struck out only three batters. The full sequence explains the difference: several early misses led to eventual contact or a walk. Lowe, for example, recovered from 0–2 to walk in the fourth inning after seven pitches. Strike acquisition and finishing a plate appearance are separate tasks.
Jo Adell opened that fourth inning with a 106.7-mph double before Lowe walked. Travis Bazzana then lined out, and Patrick Bailey’s 62.4-mph grounder became a double play. That low-speed contact was useful, but it does not erase the hard double or the walk that created the situation.
All 17 balls in play have recorded exit speeds. Eight were hard-hit, compared with three of 16 in Game 2. Some forceful contact stayed in the park or found fielders, including Bazzana’s 102.0-mph flyout in the second. The one-run line includes those outcomes; it should not be read as evidence that Cleveland consistently struggled to hit the ball firmly.
The four-seamer’s inning average moved from 97.7 mph in the third, across 10 pitches, to 96.3 in the fifth, across 10, and 96.4 in the sixth, across nine. That is an observed speed change, not a diagnosis of fatigue. The sixth began with DeLauter’s 105.9-mph double. After Adell grounded out, Lowe’s 105.5-mph single scored Cleveland’s first run and ended Peralta’s outing with a 3–1 lead.
Cam Booser retired the next two hitters and stranded Lowe, keeping Peralta’s final line at one run. Game 6 supports a narrower conclusion than the score alone: Peralta retained a harder fastball and returned to a familiar Rays changeup share, while walks and hard contact required favorable outcomes and relief help. The next useful test is whether that combination can keep producing outs when more of the firm contact becomes hits.
Inning samples in context
| Inning | Pitches | Cumulative | Four-seam fastball mph | Measured n | Outs |
|---|---|---|---|---|---|
| 1 | 13 | 13 | 97.5 | 9 | 3 |
| 2 | 16 | 29 | 97.5 | 7 | 3 |
| 3 | 19 | 48 | 97.7 | 10 | 3 |
| 4 | 13 | 61 | 97.5 | 8 | 3 |
| 5 | 11 | 72 | 96.3 | 10 | 3 |
| 6* | 12 | 84 | 96.4 | 9 | 1 |
Every pitch: 84 of 84
Filter by pitcher, hitter, inning or pitch type. Pitch numbers belong to the named pitcher’s own outing. Select a number for the full measurement record. Pitch result and plate-appearance result or interruption are separate.
84 of 84 pitches
No pitches match these filters.
| Outing pitch | Pitcher | Inning | Hitter | Count before | Type | mph | Pitch result | PA result / interruption |
|---|---|---|---|---|---|---|---|---|
| Freddy Peralta | 1 | Steven Kwan | 0–0 | FF | 96.6 | Ball | Single | |
| Freddy Peralta | 1 | Steven Kwan | 1–0 | FF | 96.6 | Called Strike | Single | |
| Freddy Peralta | 1 | Steven Kwan | 1–1 | CH | 89.1 | Called Strike | Single | |
| Freddy Peralta | 1 | Steven Kwan | 1–2 | FF | 98.2 | Ball | Single | |
| Freddy Peralta | 1 | Steven Kwan | 2–2 | FF | 96.6 | In play, no out | Single | |
| Freddy Peralta | 1 | José Ramírez | 0–0 | CU | 85.1 | Ball | Flyout | |
| Freddy Peralta | 1 | José Ramírez | 1–0 | CH | 89.1 | In play, out(s) | Flyout | |
| Freddy Peralta | 1 | Chase DeLauter | 0–0 | CU | 85.5 | In play, out(s) | Flyout | |
| Freddy Peralta | 1 | Jo Adell | 0–0 | FF | 97.7 | Foul | Pop Out | |
| Freddy Peralta | 1 | Jo Adell | 0–1 | FF | 98.1 | Ball | Pop Out | |
| Freddy Peralta | 1 | Jo Adell | 1–1 | FF | 97.4 | Called Strike | Pop Out | |
| Freddy Peralta | 1 | Jo Adell | 1–2 | FF | 97.0 | Ball | Pop Out | |
| Freddy Peralta | 1 | Jo Adell | 2–2 | FF | 98.9 | In play, out(s) | Pop Out | |
| Freddy Peralta | 2 | Nathaniel Lowe | 0–0 | CU | 82.7 | Ball | Strikeout | |
| Freddy Peralta | 2 | Nathaniel Lowe | 1–0 | FF | 97.8 | Swinging Strike | Strikeout | |
| Freddy Peralta | 2 | Nathaniel Lowe | 1–1 | FF | 97.3 | Swinging Strike | Strikeout | |
| Freddy Peralta | 2 | Nathaniel Lowe | 1–2 | FF | 97.3 | Foul | Strikeout | |
| Freddy Peralta | 2 | Nathaniel Lowe | 1–2 | CH | 90.0 | Swinging Strike | Strikeout | |
| Freddy Peralta | 2 | Travis Bazzana | 0–0 | FF | 97.5 | Ball | Flyout | |
| Freddy Peralta | 2 | Travis Bazzana | 1–0 | CH | 89.2 | Swinging Strike | Flyout | |
| Freddy Peralta | 2 | Travis Bazzana | 1–1 | CH | 90.3 | Swinging Strike | Flyout | |
| Freddy Peralta | 2 | Travis Bazzana | 1–2 | CH | 88.4 | Ball | Flyout | |
| Freddy Peralta | 2 | Travis Bazzana | 2–2 | FF | 97.6 | Foul | Flyout | |
| Freddy Peralta | 2 | Travis Bazzana | 2–2 | CH | 89.6 | In play, out(s) | Flyout | |
| Freddy Peralta | 2 | Patrick Bailey | 0–0 | CH | 90.9 | Swinging Strike | Flyout | |
| Freddy Peralta | 2 | Patrick Bailey | 0–1 | CH | 89.7 | Ball | Flyout | |
| Freddy Peralta | 2 | Patrick Bailey | 1–1 | FF | 97.9 | Swinging Strike | Flyout | |
| Freddy Peralta | 2 | Patrick Bailey | 1–2 | CH | 89.3 | Ball | Flyout | |
| Freddy Peralta | 2 | Patrick Bailey | 2–2 | FF | 97.4 | In play, out(s) | Flyout | |
| Freddy Peralta | 3 | Petey Halpin | 0–0 | FF | 95.7 | Swinging Strike | Strikeout | |
| Freddy Peralta | 3 | Petey Halpin | 0–1 | FF | 97.9 | Ball | Strikeout | |
| Freddy Peralta | 3 | Petey Halpin | 1–1 | CH | 88.0 | Foul | Strikeout | |
| Freddy Peralta | 3 | Petey Halpin | 1–2 | FF | 96.4 | Swinging Strike | Strikeout | |
| Freddy Peralta | 3 | Brayan Rocchio | 0–0 | CU | 83.8 | Called Strike | Single | |
| Freddy Peralta | 3 | Brayan Rocchio | 0–1 | CH | 88.8 | In play, no out | Single | |
| Freddy Peralta | 3 | Steven Kwan | 0–0 | CU | 83.9 | Called Strike | Forceout | |
| Freddy Peralta | 3 | Steven Kwan | 0–1 | FF | 96.6 | Foul | Forceout | |
| Freddy Peralta | 3 | Steven Kwan | 0–2 | CH | 89.9 | Foul | Forceout | |
| Freddy Peralta | 3 | Steven Kwan | 0–2 | CH | 88.0 | In play, out(s) | Forceout | |
| Freddy Peralta | 3 | José Ramírez | 0–0 | CH | 89.2 | Ball | Walk | |
| Freddy Peralta | 3 | José Ramírez | 1–0 | CH | 87.7 | Ball | Walk | |
| Freddy Peralta | 3 | José Ramírez | 2–0 | FF | 98.7 | Ball | Walk | |
| Freddy Peralta | 3 | José Ramírez | 3–0 | FF | 97.9 | Ball | Walk | |
| Freddy Peralta | 3 | Chase DeLauter | 0–0 | FF | 98.5 | Swinging Strike | Strikeout | |
| Freddy Peralta | 3 | Chase DeLauter | 0–1 | FF | 98.3 | Ball | Strikeout | |
| Freddy Peralta | 3 | Chase DeLauter | 1–1 | FF | 99.0 | Swinging Strike | Strikeout | |
| Freddy Peralta | 3 | Chase DeLauter | 1–2 | CH | 89.0 | Ball In Dirt | Strikeout | |
| Freddy Peralta | 3 | Chase DeLauter | 2–2 | FF | 97.8 | Called Strike | Strikeout | |
| Freddy Peralta | 4 | Jo Adell | 0–0 | FF | 97.5 | Swinging Strike | Double | |
| Freddy Peralta | 4 | Jo Adell | 0–1 | FF | 97.7 | Ball | Double | |
| Freddy Peralta | 4 | Jo Adell | 1–1 | FF | 97.8 | In play, no out | Double | |
| Freddy Peralta | 4 | Nathaniel Lowe | 0–0 | FF | 97.7 | Swinging Strike | Walk | |
| Freddy Peralta | 4 | Nathaniel Lowe | 0–1 | CH | 88.5 | Foul | Walk | |
| Freddy Peralta | 4 | Nathaniel Lowe | 0–2 | FF | 96.3 | Foul | Walk | |
| Freddy Peralta | 4 | Nathaniel Lowe | 0–2 | FF | 96.0 | Ball | Walk | |
| Freddy Peralta | 4 | Nathaniel Lowe | 1–2 | CU | 83.9 | Ball In Dirt | Walk | |
| Freddy Peralta | 4 | Nathaniel Lowe | 2–2 | FF | 98.1 | Ball | Walk | |
| Freddy Peralta | 4 | Nathaniel Lowe | 3–2 | CH | 87.3 | Ball | Walk | |
| Freddy Peralta | 4 | Travis Bazzana | 0–0 | CH | 88.9 | In play, out(s) | Lineout | |
| Freddy Peralta | 4 | Patrick Bailey | 0–0 | FF | 98.5 | Called Strike | GIDP | |
| Freddy Peralta | 4 | Patrick Bailey | 0–1 | CH | 89.2 | In play, out(s) | GIDP | |
| Freddy Peralta | 5 | Petey Halpin | 0–0 | FF | 97.2 | In play, out(s) | Flyout | |
| Freddy Peralta | 5 | Brayan Rocchio | 0–0 | FF | 96.5 | Called Strike | Flyout | |
| Freddy Peralta | 5 | Brayan Rocchio | 0–1 | FF | 97.7 | In play, out(s) | Flyout | |
| Freddy Peralta | 5 | Steven Kwan | 0–0 | FF | 95.9 | Ball | Walk | |
| Freddy Peralta | 5 | Steven Kwan | 1–0 | FF | 96.3 | Ball | Walk | |
| Freddy Peralta | 5 | Steven Kwan | 2–0 | FF | 94.7 | Called Strike | Walk | |
| Freddy Peralta | 5 | Steven Kwan | 2–1 | FF | 96.2 | Ball | Walk | |
| Freddy Peralta | 5 | Steven Kwan | 3–1 | FF | 95.1 | Ball | Walk | |
| Freddy Peralta | 5 | José Ramírez | 0–0 | CH | 89.9 | Called Strike | Flyout | |
| Freddy Peralta | 5 | José Ramírez | 0–1 | FF | 97.0 | Ball | Flyout | |
| Freddy Peralta | 5 | José Ramírez | 1–1 | FF | 96.9 | In play, out(s) | Flyout | |
| Freddy Peralta | 6 | Chase DeLauter | 0–0 | FF | 97.2 | Ball | Double | |
| Freddy Peralta | 6 | Chase DeLauter | 1–0 | FF | 95.5 | Ball | Double | |
| Freddy Peralta | 6 | Chase DeLauter | 2–0 | FF | 96.2 | Foul | Double | |
| Freddy Peralta | 6 | Chase DeLauter | 2–1 | FF | 95.6 | In play, no out | Double | |
| Freddy Peralta | 6 | Jo Adell | 0–0 | FF | 97.5 | Ball | Groundout | |
| Freddy Peralta | 6 | Jo Adell | 1–0 | CH | 88.0 | Swinging Strike | Groundout | |
| Freddy Peralta | 6 | Jo Adell | 1–1 | FF | 97.0 | In play, out(s) | Groundout | |
| Freddy Peralta | 6 | Nathaniel Lowe | 0–0 | CH | 87.3 | Ball | Single | |
| Freddy Peralta | 6 | Nathaniel Lowe | 1–0 | FF | 97.0 | Ball | Single | |
| Freddy Peralta | 6 | Nathaniel Lowe | 2–0 | CH | 88.0 | Ball | Single | |
| Freddy Peralta | 6 | Nathaniel Lowe | 3–0 | FF | 96.0 | Called Strike | Single | |
| Freddy Peralta | 6 | Nathaniel Lowe | 3–1 | FF | 95.3 | In play, run(s) | Single |
Sources, definitions and limitations
The official final MLB record supplies events, final calls, pitching lines and runner responsibility for Cleveland at Tampa Bay on October 19, 2026. Baseball Savant’s complete gamefeed supplies tracking measurements. Both were retrieved October 21, 2026, at approximately 17:35 UTC (11:35 a.m. MDT). The final score was Tampa Bay 7, Cleveland 3. Complete physical pitch identifiers, sequence, counts before each pitch, batters faced, strikeouts and integer outs were reconciled against the official record. Automatic count events, pickoffs and other nonpitch events are separate; none adds a physical pitch. Final calls after challenges are retained.
Freddy Peralta: 84 physical pitches, with speed, spin, extension, induced vertical break, horizontal movement, plate coordinates and recorded vertical boundaries available for every pitch. Measured exit speed is available for 17 of 17 balls in play. No missing measurement is replaced with zero.
The fixed primary baseline contains 2,959 physical pitches in 32 2026 regular-season starter appearances for New York Mets and Tampa Bay Rays, 2026-03-26 through 2026-09-25. Full pregame 2026 regular-season starter sample across New York and Tampa Bay; current-team sample is supplied separately. The frozen regular-season tracking export was reconciled against official appearance logs. All postseason games, including the target outing, are excluded.
Because Peralta changed clubs, the secondary comparison keeps his 866 Rays regular-season pitches from 10 starts separately identified. The prior analyzed outing is ALCS Game 2 on October 13; its 99 pitches are a postseason comparison, not part of the regular-season denominator.
Pitch share uses all physical pitches, retaining uncommon season classifications and types unused in this outing. A change in share is in percentage points. Conventional tracking whiffs include swinging strikes, blocked swinging strikes, caught foul tips and missed bunts. The swing denominator includes those events, fouls, bunt attempts and balls in play. A caught foul tip involves contact and is not a literal swing-and-miss. Called strikes and completed strikeout plate appearances are counted separately. The three outings here contain no caught foul tips or bunt attempts.
The descriptive zone uses the ball’s center within a 17-inch-wide rectangle and each pitch’s recorded vertical boundaries. Chase means a swing outside that rectangle, excluding missing coordinates. This does not recreate an umpire or ABS ruling: ball size, recorded boundaries and the source’s own zone classification can differ. The original Savant zone flag remains in each pitch’s detail. Locations are in feet from catcher view; speed is mph, spin rpm, extension feet and movement inches. Induced vertical break is relative to a gravity-only trajectory and does not mean a pitch physically rises.
Hard-hit contact is a measured exit speed of at least 95 mph. Savant expected contact values are model estimates, separate from actual hits and outs. Baseball innings use integer outs: 5.1 means 5⅓ innings, 0.1 one out and 1.0 three outs. Inherited-run responsibility follows the official scoring record, including force-out replacements. A single outing, especially three or nine pitches, does not establish intention, fatigue, injury or a lasting trend.