
MLB · Pitching Data
Peralta built six scoreless innings around a heavier fastball mix
Freddy Peralta threw 71 four-seamers in ALCS Game 2, while changeups finished half his strikeouts. Explore all 99 pitches and the contact behind his scoreless line.
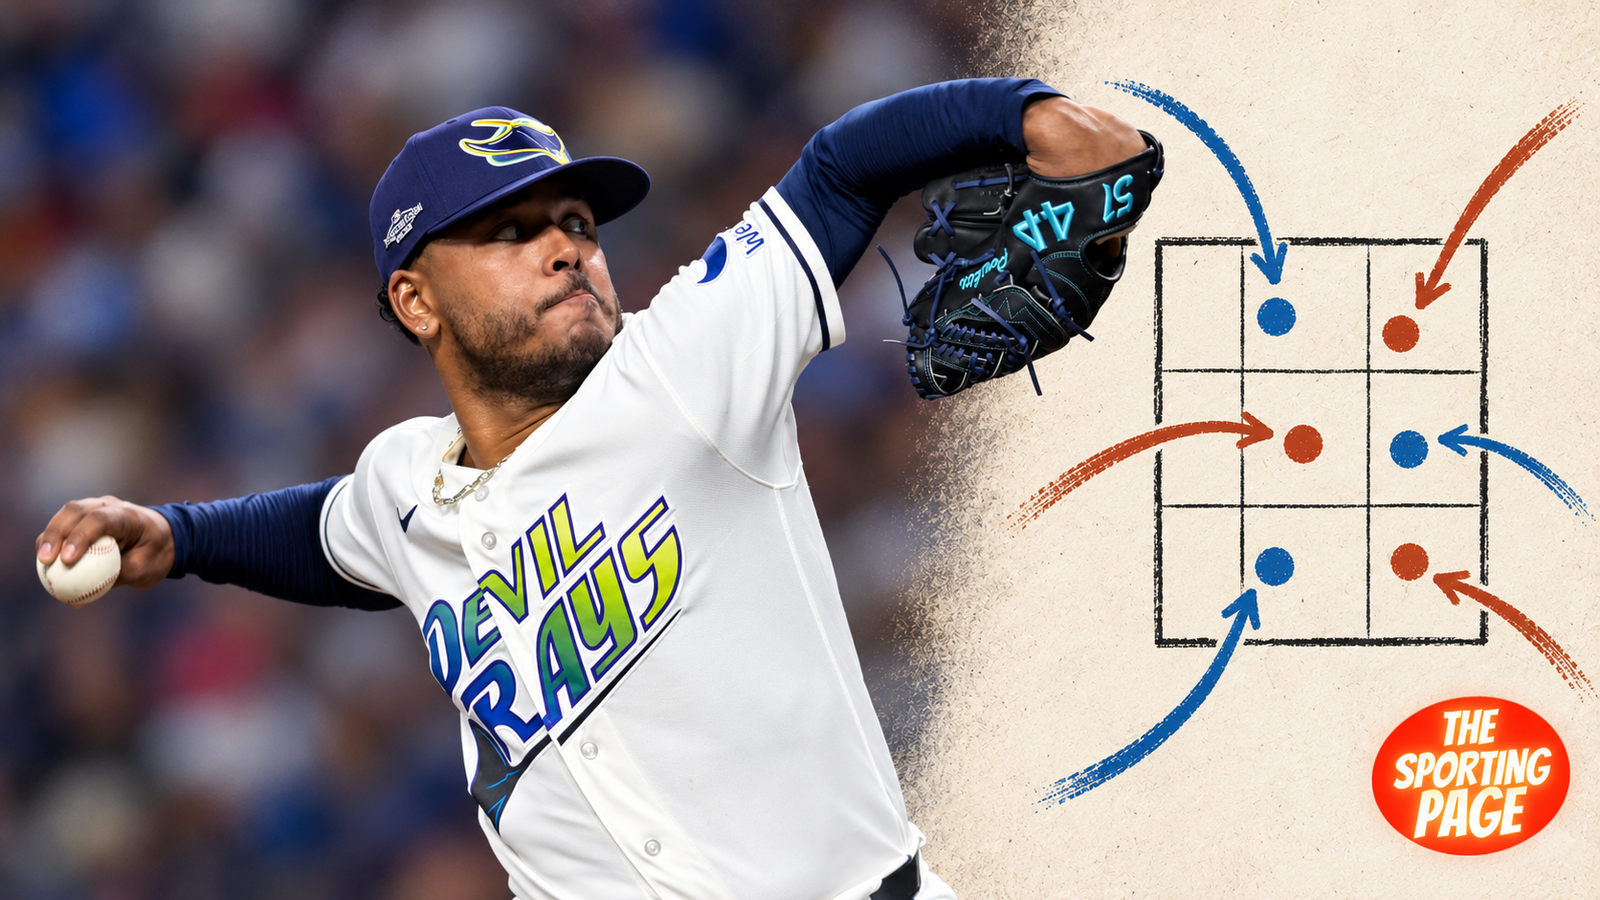
Petey Halpin fouled off four Freddy Peralta fastballs in the second inning. Between those swings, a fastball sailed high for a wild pitch that moved Travis Bazzana to second. Peralta then finished the six-pitch confrontation with an 88.8-mph changeup below the recorded strike zone, drawing a swinging strikeout with a 1–2 count.
The sequence contained both the strength and the complication of Peralta’s ALCS Game 2 start. His four-seamer supplied most of the pitches, but his changeup provided a different finish when fastball contact had prolonged an at-bat. He completed six scoreless innings at Tropicana Field on October 13, allowing four hits and two walks with six strikeouts on 99 pitches. Tampa Bay beat Cleveland 3–1.
Peralta threw 71 four-seamers, and three of his six strikeouts ended on changeups. His slower pitches retained a specific role within the fastball-heavy selection. The four-seamer acquired strikes and outs, while the changeup supplied another way to finish left-handed hitters. Walks and several favorable contact outcomes qualify the scoreless result.
Freddy Peralta's scoreless start in Game 2
More fastballs, with a separate job for the changeup
The primary comparison contains 2,959 physical pitches from 32 regular-season starts for the Mets and Rays, March 26 through September 25. The four-seamer made up 53.0% of that sample. Its Game 2 share was 71.7%, an increase of 18.7 percentage points. The full season denominator retains pitch types he did not throw in this game.
His 10 Tampa Bay regular-season starts offer a narrower check: 866 pitches from August 4 through September 25. Four-seamers accounted for 52.1% and averaged 94.8 mph. The larger Game 2 fastball allocation was present relative to both the full season and his Rays-only sample.
The opponent’s handedness affects that comparison. Twenty of his 25 plate appearances came against batters hitting left-handed. Even within those matchups, he threw four-seamers on 62 of 89 pitches, or 69.7%, compared with 51.4% against left-handed hitters in the regular-season sample. The overall increase was therefore not solely a consequence of facing more left-handed hitters.
His four-seamer averaged 96.9 mph, compared with 94.3 across the regular season. That faster postseason speed was already present in his October 5 start against the Yankees, when he averaged 96.8 mph with 43 four-seamers among 66 pitches. In Game 2 against Cleveland, the pitch supplied nine called strikes and 10 recorded whiffs in 45 swing attempts.
Nathaniel Lowe’s fourth-inning strikeout showed that work directly. After two fastballs for balls, Lowe took a fastball for a strike and foul-tipped another. Peralta finished him with a 97.3-mph four-seamer above Lowe’s recorded zone. That five-pitch at-bat also shows why the final pitch alone cannot explain the out: the preceding taken strike and foul tip recovered a 2–0 count.
The changeup accounted for 18 pitches, or 18.2%, compared with 23.4% in the regular season. It generated four recorded whiffs in eight swings and ended the second-inning strikeouts of Halpin and Brayan Rocchio, then Halpin’s strikeout in the sixth. Ten curveballs supplied three called strikes and one whiff, adding another route to a strike without accounting for a strikeout finish.
Across the full outing, Peralta recorded 15 whiffs in 56 swing attempts, a 26.8% rate. The season sample had 371 in 1,419 attempts, or 26.1%. Heavier and faster four-seamers did not produce a broad rise in aggregate whiffs. The common tracking definition includes six caught foul tips in Game 2, which involved bat contact. Nine other attempts were actual swing-and-miss strikes.
Season repertoire and Game 2
Scale: 0–100%. Gray: regular season. Blue: Game 2.
Four-seam fastball
Change: +18.7 percentage points.
Changeup
Change: -5.2 percentage points.
Curveball
Change: -2.8 percentage points.
Sweeper
Change: -5.7 percentage points.
Slider
Change: -4.0 percentage points.
CS
Change: -0.9 percentage points.
| Type | Pitches | Share | Mean mph | Max mph | Speed n | Whiffs / swings | Called strikes | IVB in | Spin rpm |
|---|---|---|---|---|---|---|---|---|---|
| Four-seam fastball | 71 | 71.7% | 96.9 | 99.4 | 71 | 10/45 | 9 | 17.8 | 2484 |
| Changeup | 18 | 18.2% | 88.8 | 90.6 | 18 | 4/8 | 0 | 4.4 | 1898 |
| Curveball | 10 | 10.1% | 82.2 | 83.7 | 10 | 1/3 | 3 | -0.7 | 2240 |
IVB is induced vertical break relative to a gravity-only trajectory. It does not mean the ball rises. Rates and average measurements describe this appearance.
Petey Halpin: inning 2
A scoreless line still included escapes and hard contact
The changeup’s effective finishes came when Cleveland offered at it. All ten that were taken became balls, and none became a called strike. Bazzana also singled off one in the second inning. Its four whiffs in eight swings therefore coexisted with pitches that hitters declined to chase and a hit on contact.
Both walks went to Chase DeLauter. The third-inning confrontation cost eight pitches after Peralta reached a 1–2 count. In the fifth, DeLauter reached 0–2 on a fastball miss and foul, then took four balls after another foul. José Ramírez had singled and stole second during that at-bat, leaving two runners aboard before Jo Adell lined out to end the inning.
Austin Hedges’ second-inning hit by pitch was a separate baserunner from those two walks. Tampa Bay challenged the ruling, and it was upheld. Together with the wild pitch during Halpin’s at-bat, it shows that keeping Cleveland scoreless required more than simply avoiding hard contact or allowing no walks.
Contact nevertheless helps explain the result. The 16 measured balls in play averaged 84.0 mph. His regular-season average was 87.0 across 502 measured contacts, with one additional ball in play lacking an exit-speed measurement. Three of Cleveland’s contacts reached 95 mph, Statcast’s hard-hit threshold. The Guardians found four hits without consistently striking the ball hard, including Steven Kwan’s 57.7-mph single to begin the game.
The clearest warning against equating an out with harmless contact came in the sixth. Bazzana hit a 96.8-mph fastball at 102.4 mph, with a recorded 401-foot distance, but Jonny DeLuca caught it in center. That was one of the three hard-hit balls, and it remained an out in the pitching line. The result includes where the ball went and what the defense did, alongside the quality of the pitch.
Peralta used only seven pitches in the first inning, then 25 in the second. His workload reached 85 after five innings, and Halpin’s nine-pitch final plate appearance took it to 99. Four-seam velocity stayed within a narrow band of inning averages, from 96.5 to 97.2 mph; the sixth averaged 96.7 across nine fastballs.
The last out again came on a changeup, this time an 89.0-mph pitch that Halpin foul-tipped for strike three after three full-count fouls. Peralta left with a 3–0 lead and no runners for the bullpen to inherit. The full record supports an outing built around increased fastball use, with changeups supplying important finishes and favorable contact outcomes keeping his six innings scoreless. A subsequent matchup can test whether he retains that larger fastball share while limiting walks and the harder contact that could change the result.
Inning samples in context
| Inning | Pitches | Cumulative | Four-seam fastball mph | Measured n | Outs |
|---|---|---|---|---|---|
| 1 | 7 | 7 | 96.5 | 7 | 3 |
| 2 | 25 | 32 | 97.2 | 19 | 3 |
| 3 | 20 | 52 | 96.9 | 11 | 3 |
| 4 | 13 | 65 | 96.6 | 12 | 3 |
| 5 | 20 | 85 | 96.8 | 13 | 3 |
| 6 | 14 | 99 | 96.7 | 9 | 3 |
Every pitch: 99 of 99
Filter by pitcher, hitter, inning or pitch type. Pitch numbers belong to the named pitcher’s own outing. Select a number for the full measurement record. Pitch result and plate-appearance result or interruption are separate.
99 of 99 pitches
No pitches match these filters.
| Outing pitch | Pitcher | Inning | Hitter | Count before | Type | mph | Pitch result | PA result / interruption |
|---|---|---|---|---|---|---|---|---|
| Freddy Peralta | 1 | Steven Kwan | 0–0 | FF | 96.9 | Called Strike | Single | |
| Freddy Peralta | 1 | Steven Kwan | 0–1 | FF | 98.0 | In play, no out | Single | |
| Freddy Peralta | 1 | José Ramírez | 0–0 | FF | 95.5 | In play, out(s) | Flyout | |
| Freddy Peralta | 1 | Chase DeLauter | 0–0 | FF | 96.6 | Swinging Strike | Strikeout | |
| Freddy Peralta | 1 | Chase DeLauter | 0–1 | FF | 96.0 | Called Strike | Strikeout | |
| Freddy Peralta | 1 | Chase DeLauter | 0–2 | FF | 96.3 | Foul Tip | Strikeout | |
| Freddy Peralta | 1 | Jo Adell | 0–0 | FF | 96.4 | In play, out(s) | Flyout | |
| Freddy Peralta | 2 | Nathaniel Lowe | 0–0 | FF | 97.9 | Called Strike | Strikeout | |
| Freddy Peralta | 2 | Nathaniel Lowe | 0–1 | FF | 97.7 | Ball | Strikeout | |
| Freddy Peralta | 2 | Nathaniel Lowe | 1–1 | FF | 97.1 | Foul | Strikeout | |
| Freddy Peralta | 2 | Nathaniel Lowe | 1–2 | FF | 97.7 | Foul | Strikeout | |
| Freddy Peralta | 2 | Nathaniel Lowe | 1–2 | FF | 98.2 | Ball | Strikeout | |
| Freddy Peralta | 2 | Nathaniel Lowe | 2–2 | CH | 89.7 | Foul | Strikeout | |
| Freddy Peralta | 2 | Nathaniel Lowe | 2–2 | FF | 98.4 | Ball | Strikeout | |
| Freddy Peralta | 2 | Nathaniel Lowe | 3–2 | FF | 95.9 | Swinging Strike | Strikeout | |
| Freddy Peralta | 2 | Travis Bazzana | 0–0 | FF | 98.2 | Foul | Single | |
| Freddy Peralta | 2 | Travis Bazzana | 0–1 | FF | 98.2 | Foul | Single | |
| Freddy Peralta | 2 | Travis Bazzana | 0–2 | FF | 96.5 | Ball | Single | |
| Freddy Peralta | 2 | Travis Bazzana | 1–2 | CH | 90.6 | In play, no out | Single | |
| Freddy Peralta | 2 | Petey Halpin | 0–0 | FF | 96.6 | Foul | Strikeout | |
| Freddy Peralta | 2 | Petey Halpin | 0–1 | FF | 97.4 | Foul | Strikeout | |
| Freddy Peralta | 2 | Petey Halpin | 0–2 | FF | 94.6 | Foul | Strikeout | |
| Freddy Peralta | 2 | Petey Halpin | 0–2 | FF | 94.1 | Ball | Strikeout | |
| Freddy Peralta | 2 | Petey Halpin | 1–2 | FF | 98.0 | Foul | Strikeout | |
| Freddy Peralta | 2 | Petey Halpin | 1–2 | CH | 88.8 | Swinging Strike (Blocked) | Strikeout | |
| Freddy Peralta | 2 | Austin Hedges | 0–0 | FF | 99.0 | Hit By Pitch | Hit By Pitch | |
| Freddy Peralta | 2 | Brayan Rocchio | 0–0 | CH | 88.5 | Ball | Strikeout | |
| Freddy Peralta | 2 | Brayan Rocchio | 1–0 | FF | 97.2 | Foul | Strikeout | |
| Freddy Peralta | 2 | Brayan Rocchio | 1–1 | FF | 98.0 | Called Strike | Strikeout | |
| Freddy Peralta | 2 | Brayan Rocchio | 1–2 | FF | 95.9 | Foul | Strikeout | |
| Freddy Peralta | 2 | Brayan Rocchio | 1–2 | CH | 89.3 | Ball | Strikeout | |
| Freddy Peralta | 2 | Brayan Rocchio | 2–2 | CH | 89.1 | Foul Tip | Strikeout | |
| Freddy Peralta | 3 | Steven Kwan | 0–0 | CU | 83.3 | Called Strike | Lineout | |
| Freddy Peralta | 3 | Steven Kwan | 0–1 | CH | 89.2 | Ball | Lineout | |
| Freddy Peralta | 3 | Steven Kwan | 1–1 | FF | 97.4 | Ball | Lineout | |
| Freddy Peralta | 3 | Steven Kwan | 2–1 | FF | 96.6 | Foul | Lineout | |
| Freddy Peralta | 3 | Steven Kwan | 2–2 | CH | 89.6 | In play, out(s) | Lineout | |
| Freddy Peralta | 3 | José Ramírez | 0–0 | FF | 97.8 | Called Strike | Pop Out | |
| Freddy Peralta | 3 | José Ramírez | 0–1 | FF | 97.6 | In play, out(s) | Pop Out | |
| Freddy Peralta | 3 | Chase DeLauter | 0–0 | CH | 89.6 | Ball | Walk | |
| Freddy Peralta | 3 | Chase DeLauter | 1–0 | CH | 90.6 | Swinging Strike | Walk | |
| Freddy Peralta | 3 | Chase DeLauter | 1–1 | CU | 80.7 | Swinging Strike | Walk | |
| Freddy Peralta | 3 | Chase DeLauter | 1–2 | FF | 96.2 | Ball | Walk | |
| Freddy Peralta | 3 | Chase DeLauter | 2–2 | FF | 96.1 | Ball | Walk | |
| Freddy Peralta | 3 | Chase DeLauter | 3–2 | CU | 83.7 | Foul | Walk | |
| Freddy Peralta | 3 | Chase DeLauter | 3–2 | FF | 95.6 | Foul | Walk | |
| Freddy Peralta | 3 | Chase DeLauter | 3–2 | CH | 88.7 | Ball | Walk | |
| Freddy Peralta | 3 | Jo Adell | 0–0 | FF | 97.8 | Foul Tip | Flyout | |
| Freddy Peralta | 3 | Jo Adell | 0–1 | FF | 96.5 | Foul | Flyout | |
| Freddy Peralta | 3 | Jo Adell | 0–2 | CH | 87.0 | Ball | Flyout | |
| Freddy Peralta | 3 | Jo Adell | 1–2 | FF | 98.7 | Ball | Flyout | |
| Freddy Peralta | 3 | Jo Adell | 2–2 | FF | 95.9 | In play, out(s) | Flyout | |
| Freddy Peralta | 4 | Nathaniel Lowe | 0–0 | FF | 96.8 | Ball | Strikeout | |
| Freddy Peralta | 4 | Nathaniel Lowe | 1–0 | FF | 96.7 | Ball | Strikeout | |
| Freddy Peralta | 4 | Nathaniel Lowe | 2–0 | FF | 95.6 | Called Strike | Strikeout | |
| Freddy Peralta | 4 | Nathaniel Lowe | 2–1 | FF | 97.8 | Foul Tip | Strikeout | |
| Freddy Peralta | 4 | Nathaniel Lowe | 2–2 | FF | 97.3 | Swinging Strike | Strikeout | |
| Freddy Peralta | 4 | Travis Bazzana | 0–0 | CU | 83.3 | Ball | Pop Out | |
| Freddy Peralta | 4 | Travis Bazzana | 1–0 | FF | 95.9 | Foul Tip | Pop Out | |
| Freddy Peralta | 4 | Travis Bazzana | 1–1 | FF | 97.3 | In play, out(s) | Pop Out | |
| Freddy Peralta | 4 | Petey Halpin | 0–0 | FF | 96.8 | Ball | Single | |
| Freddy Peralta | 4 | Petey Halpin | 1–0 | FF | 95.9 | Foul | Single | |
| Freddy Peralta | 4 | Petey Halpin | 1–1 | FF | 96.0 | Swinging Strike | Single | |
| Freddy Peralta | 4 | Petey Halpin | 1–2 | FF | 96.0 | In play, no out | Single | |
| Freddy Peralta | 4 | Austin Hedges | 0–0 | FF | 97.3 | In play, out(s) | Pop Out | |
| Freddy Peralta | 5 | Brayan Rocchio | 0–0 | FF | 95.4 | Called Strike | Flyout | |
| Freddy Peralta | 5 | Brayan Rocchio | 0–1 | FF | 97.0 | In play, out(s) | Flyout | |
| Freddy Peralta | 5 | Steven Kwan | 0–0 | CU | 82.0 | Ball | Lineout | |
| Freddy Peralta | 5 | Steven Kwan | 1–0 | CU | 83.1 | Called Strike | Lineout | |
| Freddy Peralta | 5 | Steven Kwan | 1–1 | FF | 96.9 | In play, out(s) | Lineout | |
| Freddy Peralta | 5 | José Ramírez | 0–0 | FF | 96.5 | Called Strike | Single | |
| Freddy Peralta | 5 | José Ramírez | 0–1 | FF | 96.6 | Called Strike | Single | |
| Freddy Peralta | 5 | José Ramírez | 0–2 | CH | 87.6 | Foul | Single | |
| Freddy Peralta | 5 | José Ramírez | 0–2 | FF | 95.5 | Ball | Single | |
| Freddy Peralta | 5 | José Ramírez | 1–2 | CU | 77.5 | Ball | Single | |
| Freddy Peralta | 5 | José Ramírez | 2–2 | FF | 96.6 | In play, no out | Single | |
| Freddy Peralta | 5 | Chase DeLauter | 0–0 | FF | 97.6 | Swinging Strike | Walk | |
| Freddy Peralta | 5 | Chase DeLauter | 0–1 | FF | 96.6 | Foul | Walk | |
| Freddy Peralta | 5 | Chase DeLauter | 0–2 | FF | 96.4 | Foul | Walk | |
| Freddy Peralta | 5 | Chase DeLauter | 0–2 | CH | 86.8 | Ball | Walk | |
| Freddy Peralta | 5 | Chase DeLauter | 1–2 | CH | 88.4 | Ball | Walk | |
| Freddy Peralta | 5 | Chase DeLauter | 2–2 | FF | 95.3 | Ball | Walk | |
| Freddy Peralta | 5 | Chase DeLauter | 3–2 | CH | 87.2 | Ball | Walk | |
| Freddy Peralta | 5 | Jo Adell | 0–0 | FF | 99.4 | Foul | Lineout | |
| Freddy Peralta | 5 | Jo Adell | 0–1 | FF | 99.0 | In play, out(s) | Lineout | |
| Freddy Peralta | 6 | Nathaniel Lowe | 0–0 | CU | 82.4 | Called Strike | Groundout | |
| Freddy Peralta | 6 | Nathaniel Lowe | 0–1 | FF | 96.6 | Ball | Groundout | |
| Freddy Peralta | 6 | Nathaniel Lowe | 1–1 | FF | 96.4 | Swinging Strike | Groundout | |
| Freddy Peralta | 6 | Nathaniel Lowe | 1–2 | FF | 98.1 | In play, out(s) | Groundout | |
| Freddy Peralta | 6 | Travis Bazzana | 0–0 | FF | 96.8 | In play, out(s) | Flyout | |
| Freddy Peralta | 6 | Petey Halpin | 0–0 | CU | 82.9 | Ball | Strikeout | |
| Freddy Peralta | 6 | Petey Halpin | 1–0 | FF | 96.1 | Foul | Strikeout | |
| Freddy Peralta | 6 | Petey Halpin | 1–1 | CH | 87.8 | Ball | Strikeout | |
| Freddy Peralta | 6 | Petey Halpin | 2–1 | FF | 96.1 | Foul | Strikeout | |
| Freddy Peralta | 6 | Petey Halpin | 2–2 | FF | 97.7 | Ball | Strikeout | |
| Freddy Peralta | 6 | Petey Halpin | 3–2 | FF | 96.8 | Foul | Strikeout | |
| Freddy Peralta | 6 | Petey Halpin | 3–2 | CU | 83.4 | Foul | Strikeout | |
| Freddy Peralta | 6 | Petey Halpin | 3–2 | FF | 95.9 | Foul | Strikeout | |
| Freddy Peralta | 6 | Petey Halpin | 3–2 | CH | 89.0 | Foul Tip | Strikeout |
Sources, definitions and limitations
The official final MLB record supplies the pitching lines, events and final calls for Cleveland at Tampa Bay on October 13, 2026. Baseball Savant’s gamefeed supplies the tracking measurements. Physical pitch identifiers, pitch counts, batters and integer outs were reconciled. Automatic balls and strikes, pickoffs and other nonpitch events stay outside the physical pitch ledger. ABS challenges use the final official call.
Freddy Peralta: 99 outing pitches. Regular-season comparison: 2,959 physical pitches in 32 starter appearances for New York Mets and Tampa Bay Rays, 2026-03-26 through 2026-09-25. Full pregame 2026 regular-season starter sample across New York and Tampa Bay; current-team sample is supplied separately. The target outing and postseason work are excluded. Tracking coverage: release, movement and plate-location fields are complete. Measured exit speed is available for 16 of 16 balls in play.
Whiff rate is conventional tracking whiffs divided by swing attempts. Swinging strikes, blocked swinging strikes, caught foul tips and missed bunts count as whiffs. A caught foul tip involves contact and is distinct from a literal swing-and-miss. Fouls, bunt attempts and balls in play enter the swing denominator. Called strikes and completed strikeout plate appearances are separate. Chase uses ball-center locations outside a 17-inch-wide rectangle and each pitch’s recorded vertical boundaries, excluding missing locations. Savant’s own zone flag remains separately available.
Pitch share uses all physical pitches in the identified sample. Speed is mph, spin rpm, extension feet and movement inches. Plate location and recorded strike-zone boundaries are feet in catcher view. Hard-hit contact means an exit speed of at least 95 mph. Missing measurements remain missing rather than zero. Expected contact outcomes are Savant model estimates, distinct from actual results. Each reliever retains a separate repertoire and baseline. Small appearances do not establish a lasting change, intention, fatigue or injury.
Sources and notes
- Official MLB final game 849813: https://statsapi.mlb.com/api/v1.1/game/849813/feed/live
- Baseball Savant complete tracking: https://baseballsavant.mlb.com/gf?game_pk=849813
- Pregame regular-season and prior-postseason samples, denominators and limitations are declared in the article methods.
- Statcast field definitions: https://baseballsavant.mlb.com/csv-docs