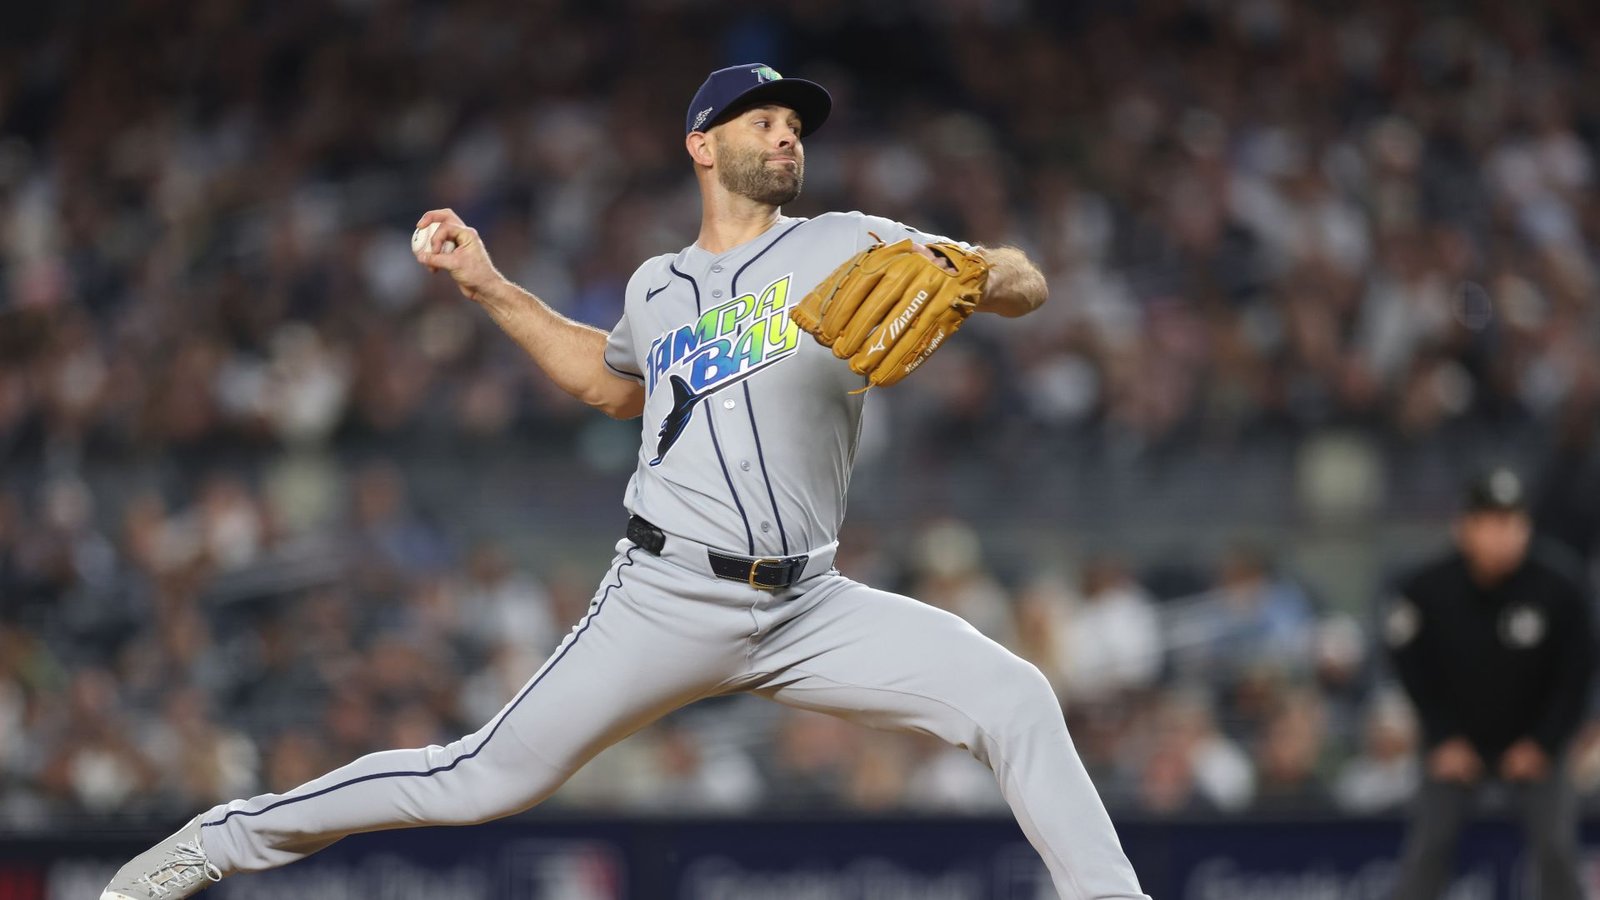
Anthony Volpe had fouled off a sinker and a four-seam fastball when Nick Martinez changed speeds in the second inning. His 77.9 mph changeup drew a swing and miss at 0–2. A called strike on a 90.3 mph cutter had started the four-pitch strikeout, so the confrontation combined a taken strike, two fouls and an off-speed finish.
Martinez allowed five hits and two earned runs in 3⅔ innings at Yankee Stadium on October 7, with one walk and three strikeouts. Tampa Bay completed its ALDS sweep with a 4–3 win, but one of the runs charged to Martinez scored after he left. His outing ended at 63 pitches after a Volpe line drive hit him in the fourth, as the official game highlight records.
The complete pitch record shows a different balance from his regular season: more changeups and cutters, fewer sinkers. That shift did not produce a higher overall rate of missed swings. It gave him several ways to acquire strikes, while the Yankees put 12 pitches into play and extended his third and fourth innings.
Regular season and Game 3
Share of all physical pitches. Scale: 0–40%.
Changeup
Cutter
Sinker
Four-seam
Slider
Curve
Pitchout
The changeup and cutter took a larger share
Martinez threw 19 changeups and 18 cutters, a combined 37 of 63 pitches. Their 58.7% share was above the combined 47.8% in his pregame regular-season sample. His sinker fell from 31.7% of that baseline to 20.6% here. The comparison covers 2,524 physical pitches in 31 starts from March 30 through September 27; it excludes this postseason outing.
The changeup supplied four of his six misses, from 12 swings. The cutter added four called strikes and one miss. Those are different contributions: a taken cutter helped Volpe fall behind, while the changeup finished him. In the third, Martinez struck out Trent Grisham looking with a 94.5 mph sinker after falling behind 2–0. A lower sinker share did not mean the pitch disappeared from important counts.
Opponent handedness complicates the selection comparison. Martinez threw 39 pitches to left-handed hitters and 24 to right-handed hitters. Fourteen of his 19 changeups went to lefties; 10 of his 13 sinkers went to righties. Those opportunities help explain the overall mix, and the record does not establish that he arrived with a new tactical plan.
His changeup averaged 77.8 mph, compared with 78.3 in the season sample. The cutter averaged 90.2, about a mile per hour above its 89.2 baseline. Across the whole outing, six misses in 34 swings produced a 17.6% whiff rate, close to the season's 17.4%. The notable difference was pitch selection, rather than a broad increase in missed bats.
Anthony Volpe: inning 2
Contact and the runner left behind
The five hits included damaging contact and a much softer result. George Lombard Jr. singled against a sinker with a 102.6 mph exit speed. In the third, Ben Rice’s single against a changeup left the bat at 97.8 mph and scored Spencer Jones. Luis García Jr. followed with a 107.9 mph single against a sinker. Martinez then retired Cody Bellinger on a 98.7 mph ground ball to end the threat with two runners stranded.
In the fourth, Lombard's 69.3 mph ground ball became a single. Austin Wells then grounded a changeup into a double play, with the ball leaving his bat at 75.4 mph. Those plays show why exit speed and actual results need separate treatment: softer contact can reach safely, while another softly hit ball can produce two outs. Six of the 12 balls in play reached the 95 mph hard-hit threshold, although their average exit speed, 86.7 mph, was close to the season baseline of 86.5.
Martinez needed eight pitches in the first inning, then 16 in the second and 24 in the third. Jones's seven-pitch walk contributed to the third-inning workload. Lombard used eight pitches to open the fourth before Volpe's five-pitch plate appearance ended in a 96.6 mph line drive to Martinez. The outing ended with two outs and Volpe on first, with Tampa Bay ahead 2–1.
Ian Seymour replaced him, and Jones doubled home Volpe. Martinez's official line therefore contains two earned runs, even though only one had scored while he remained in the game. His four-seam inning averages came from just two pitches in each inning; those small samples do not support a diagnosis of fatigue or explain the injury exit.
This start supports a narrower finding than the Rays' series result: Martinez used changeups and cutters more often than in his season sample, without increasing his overall whiff rate, and New York's contact mattered throughout. A later outing would help establish whether that selection balance persists against a different handedness mix. The 63-pitch record cannot answer that question by itself.
Filter the complete outing and select any pitch for its measurements. Pitch result and completed plate-appearance outcome are separate columns. 63 of 63 pitches No pitches match these filters.Workload and four-seam speed by inning
Inning Pitches Cumulative Four-seam mph Four-seam n Outs recorded 1 8 8 94.3 2 3 2 16 24 93.2 2 3 3 24 48 93.4 2 3 4* 15 63 93.1 2 2 All 63 pitches
Pitch Inning Hitter Count before Type mph Pitch result PA outcome 1 Trent Grisham 0-0 Cutter 90.5 Ball Pop Out 1 Trent Grisham 1-0 Cutter 90.8 Called Strike Pop Out 1 Trent Grisham 1-1 Changeup 78.4 In play, out(s) Pop Out 1 Ben Rice 0-0 Slider 85.5 In play, out(s) Groundout 1 Luis García Jr. 0-0 Four-seam 94.2 Ball Strikeout 1 Luis García Jr. 1-0 Changeup 79.7 Foul Strikeout 1 Luis García Jr. 1-1 Cutter 90.5 Foul Strikeout 1 Luis García Jr. 1-2 Four-seam 94.4 Swinging Strike Strikeout 2 Cody Bellinger 0-0 Slider 85.5 In play, out(s) Lineout 2 George Lombard Jr. 0-0 Cutter 89.7 Called Strike Single 2 George Lombard Jr. 0-1 Sinker 92.2 Ball Single 2 George Lombard Jr. 1-1 Changeup 78.0 Swinging Strike Single 2 George Lombard Jr. 1-2 Sinker 93.2 Ball Single 2 George Lombard Jr. 2-2 Sinker 93.7 In play, no out Single 2 Austin Wells 0-0 Slider 86.0 Called Strike Flyout 2 Austin Wells 0-1 Changeup 78.0 Ball Flyout 2 Austin Wells 1-1 Cutter 91.0 Ball Flyout 2 Austin Wells 2-1 Four-seam 92.8 Called Strike Flyout 2 Austin Wells 2-2 Changeup 78.4 Ball Flyout 2 Austin Wells 3-2 Cutter 90.7 In play, out(s) Flyout 2 Anthony Volpe 0-0 Cutter 90.3 Called Strike Strikeout 2 Anthony Volpe 0-1 Sinker 93.0 Foul Strikeout 2 Anthony Volpe 0-2 Four-seam 93.6 Foul Strikeout 2 Anthony Volpe 0-2 Changeup 77.9 Swinging Strike Strikeout 3 Spencer Jones 0-0 Changeup 78.9 Ball Walk 3 Spencer Jones 1-0 Cutter 89.7 Ball Walk 3 Spencer Jones 2-0 Sinker 92.4 Foul Walk 3 Spencer Jones 2-1 Changeup 76.9 Swinging Strike Walk 3 Spencer Jones 2-2 Four-seam 92.7 Ball Walk 3 Spencer Jones 3-2 Changeup 78.0 Foul Walk 3 Spencer Jones 3-2 Cutter 90.7 Ball Walk 3 José Caballero 0-0 Sinker 92.5 Ball Groundout 3 José Caballero 1-0 Cutter 89.8 In play, out(s) Groundout 3 Trent Grisham 0-0 Slider 85.5 Ball In Dirt Strikeout 3 Trent Grisham 1-0 Slider 84.5 Ball Strikeout 3 Trent Grisham 2-0 Cutter 90.0 Foul Strikeout 3 Trent Grisham 2-1 Changeup 78.4 Foul Strikeout 3 Trent Grisham 2-2 Sinker 94.5 Called Strike Strikeout 3 Ben Rice 0-0 Cutter 90.4 Foul Single 3 Ben Rice 0-1 Changeup 78.2 In play, run(s) Single 3 Luis García Jr. 0-0 Changeup 75.2 Called Strike Single 3 Luis García Jr. 0-1 Cutter 90.2 Foul Single 3 Luis García Jr. 0-2 Changeup 77.8 Ball Single 3 Luis García Jr. 1-2 Sinker 93.4 In play, no out Single 3 Cody Bellinger 0-0 Changeup 77.3 Swinging Strike Groundout 3 Cody Bellinger 0-1 Cutter 91.0 Foul Groundout 3 Cody Bellinger 0-2 Changeup 78.1 Ball Groundout 3 Cody Bellinger 1-2 Four-seam 94.1 In play, out(s) Groundout 4 George Lombard Jr. 0-0 Sinker 92.6 Ball Single 4 George Lombard Jr. 1-0 Cutter 90.8 Ball Single 4 George Lombard Jr. 2-0 Cutter 87.9 Called Strike Single 4 George Lombard Jr. 2-1 Changeup 76.9 Foul Single 4 George Lombard Jr. 2-2 Changeup 77.0 Foul Single 4 George Lombard Jr. 2-2 Four-seam 92.9 Ball Single 4 George Lombard Jr. 3-2 Sinker 93.9 Foul Single 4 George Lombard Jr. 3-2 Cutter 90.3 In play, no out Single 4 Austin Wells 0-0 Cutter 89.7 Swinging Strike GIDP 4 Austin Wells 0-1 Changeup 77.4 In play, out(s) GIDP 4 Anthony Volpe 0-0 Sinker 93.3 Ball Single 4 Anthony Volpe 1-0 Sinker 91.9 Foul Single 4 Anthony Volpe 1-1 Changeup 77.6 Ball Single 4 Anthony Volpe 2-1 Sinker 93.4 Foul Single 4 Anthony Volpe 2-2 Four-seam 93.2 In play, no out Single
Sources, definitions and limitations
The official MLB final record supplies the pitching line, score, play order and final calls. Baseball Savant's complete Game 3 feed supplies tracking. Statcast Search supplies the regular-season comparison. Game-data reporting cutoff: October 8, 2026 at 3:28 AM Mountain Time; Rays–Yankees was Final.
All 63 physical pitches reconcile by unique ID, order, type, final call and pre-pitch count, including count-changing non-pitch events. The record also reconciles 16 batters, 11 integer outs and 3 strikeouts. Baseball innings notation counts outs: .1 is one out and .2 is two. Automatic calls, intentional-walk records and non-pitch actions are excluded from physical-pitch totals.
The pregame baseline has 2,524 physical pitches in 31 regular-season starts, 2026-03-30 through 2026-09-27. Its game set and per-game totals reconcile to the official appearance log. Postseason comparisons are separate. Five baseline pitches lack spin and extension; those values remain missing in their measurement denominators.
Whiff rate means misses divided by swing attempts. Swinging strikes, blocked swinging strikes and caught foul tips count as misses. Fouls, balls in play and bunt attempts also enter the swing denominator; bunt attempts do not automatically enter the miss count. The 34 swings and six misses reconcile directly to the supplied Savant summary. Called strikes and completed strikeout plate appearances are counted separately. Hard-hit means a recorded exit speed of at least 95 mph.
Release speed is mph, spin rpm, extension feet and movement inches. Induced vertical break measures movement relative to a gravity-only path, rather than a ball physically rising. Plate locations are in feet from the catcher view, with each hitter's recorded vertical zone. The at-bat rectangle is 17 inches wide; markers keep exact locations and are not ball size. The detail panel preserves Savant's zone flag separately from the ball-center rectangle used in comparisons. See Statcast field definitions.
All outing pitches have speed, spin, extension, movement and plate coordinates. All 12 balls in play have measured exit speed and launch angle. Expected batting averages in the detail panel are Savant model estimates, not actual results. Missing non-contact measurements stay blank. These data do not establish intended targets, hitter expectations, fatigue, injury diagnosis or a lasting trend.