

MLB · AL WILD CARD GAME 2 · SEPTEMBER 30, 2026
Max Fried doubled his sweeper usage. His Game 2 success took more than missed bats.
Fried held Boston to one run in six innings as the Yankees finished a Wild Card sweep. All 98 pitches show how a changed mix, called strikes and manageable contact carried him through.
6 IP · 3 H · 1 ER · 1 BB · 6 K · 98 PITCHES
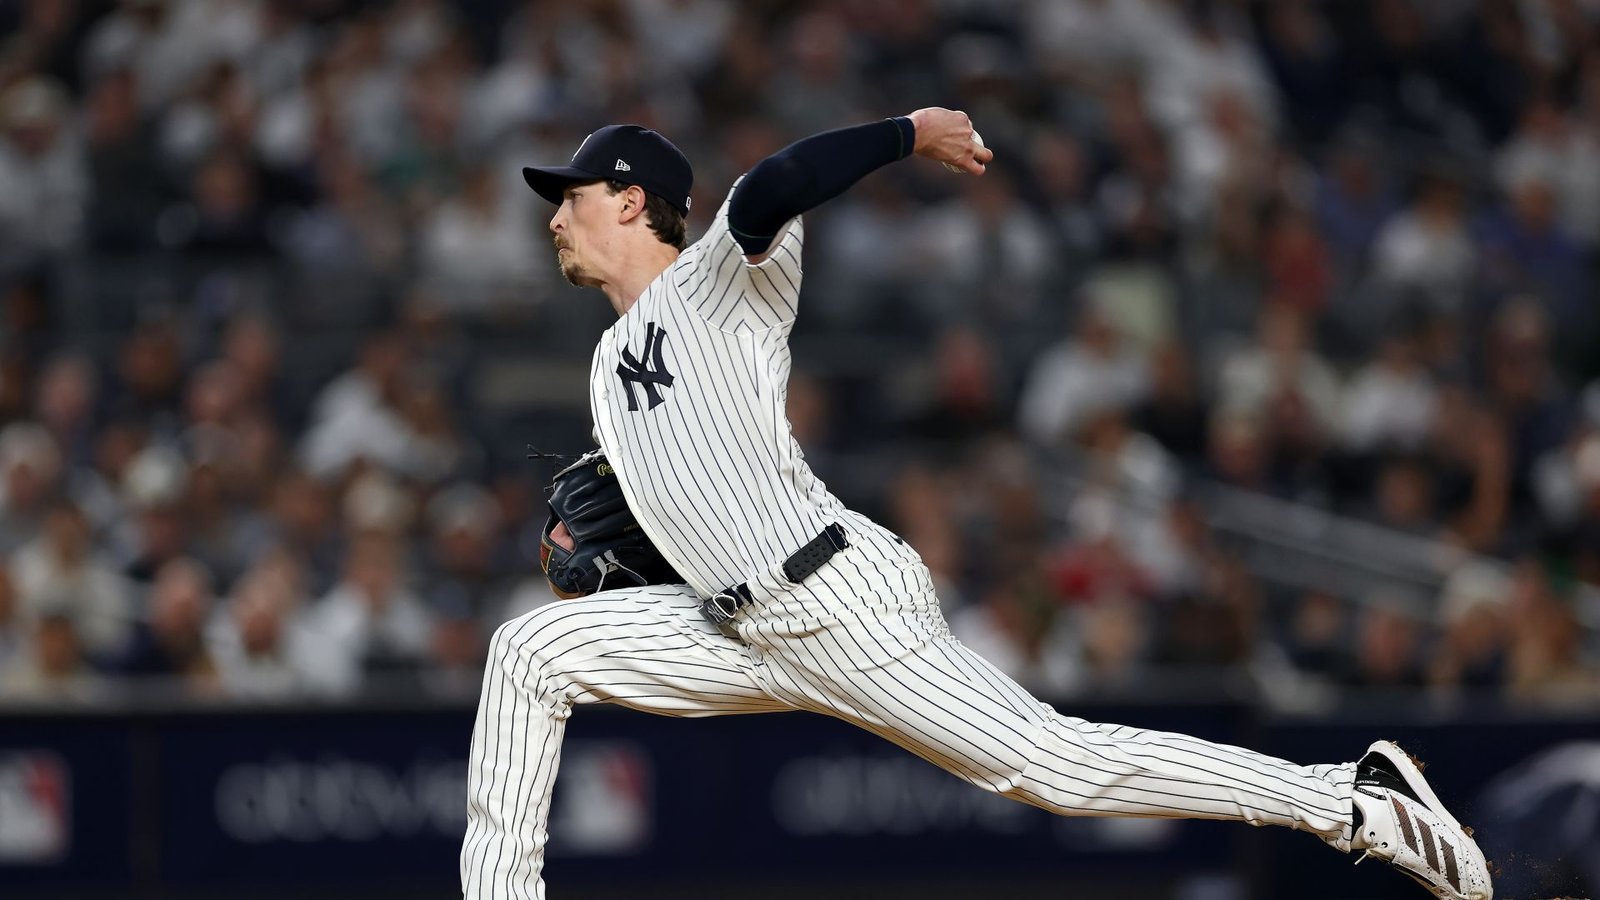
Nate Eaton stood at second base, the game was scoreless, and Max Fried had fallen behind Jahmai Jones 3–0. Two sweepers and a curveball had missed the zone. The Yankees had even challenged the first ball; the call stood. Three pitches later, Jones was walking back to the dugout.
Fried got a swing through a 92.3 mph cutter, a taken strike with a 95.5 mph four-seamer and a called third strike with an 80.1 mph sweeper. His most revealing escape in Wednesday’s AL Wild Card Game 2 came from three different pitches and two decisions not to swing. Adley Rutschman then grounded out, leaving Eaton at second.
That sequence captures a start whose strength was broader than its swing-and-miss total. Fried allowed three hits, one run and one walk while striking out six across six innings and 98 pitches at Yankee Stadium. New York eventually won 9–2 to complete the two-game sweep, but he finished his work protecting a 2–1 lead. The six-run Yankees sixth came afterward.
A different balance within a familiar repertoire
The clearest change was the sweeper. Fried threw it 25 times, or 25.5% of his pitches, compared with 12.3% during his 2026 regular season. That was a 13.2 percentage-point increase and just over twice its previous share. The sinker moved in the opposite direction, from 20.9% to 6.1%.
The comparison covers 1,696 physical pitches across 20 regular-season games, March 25 through September 22, and excludes this postseason start. It is a full-season reference, not a selected stretch of his best outings. The small slider category remains in the comparison even though Fried did not throw one in Game 2.
Fried still distributed the work. His 23 four-seamers and 23 cutters nearly matched the sweeper total; he also threw 11 curveballs, 10 changeups and 6 sinkers. No pitch accounted for much more than a quarter of the outing. The sweeper became his most frequent choice without turning this into a one-pitch performance.
More sweepers. Fewer sinkers.
Share of all physical pitches. Each bar starts at zero and uses the same 0–30% scale.
Boston’s lineup explains part of the change
Handedness matters here. Boston took 87 of Fried’s 98 pitches from the right side. Right-handed batters had accounted for 76.2% of his regular-season pitch sample, compared with 88.8% in Game 2. Fried used far more sinkers against left-handers during the season, so facing fewer of them helps explain why that pitch receded.
It does not explain the whole shift. Against right-handed hitters alone, his sweeper rose from 10.4% of the season sample to 21.8% in this game: 19 sweepers in 87 pitches. His sinker fell from 11.9% to 4.6% against that same batting side. The left-handed sample was only 11 pitches, all to Wilyer Abreu, and is too small to carry a separate trend claim.
The sweeper also appeared on 13 of 30 two-strike pitches. Fried used it throughout the outing, rather than unveiling it for a single confrontation. That is evidence of a different selection pattern. The pitch record cannot tell us what Boston expected or whether Fried had decided on this balance before the game.
Three pitches to reverse a 3–0 count
The Jones escape in the third shows why selection and execution belong together. Fried’s first three pitches were outside Savant’s recorded zone. His next three were inside it. The cutter produced the one miss; the fastball and sweeper earned takes. The hitter had to cover different speeds and movement while Fried recovered the strike zone.
The difference between the last two pitches was 15.4 mph. The sweeper also moved down relative to a gravity-only trajectory, while the four-seamer resisted that drop. Those are distinct shapes. They do not, by themselves, prove that the two pitches looked identical to Jones early in flight or that he was fooled by a particular plan.
Fried had already used variety to finish a demanding first-inning confrontation with Rutschman. After nine pitches that included four sweepers, three four-seamers, a curveball and a cutter, he landed an 87.5 mph changeup for strike three on a full count. The changeup generated no misses in six swings all night. It still supplied one of the six strikeouts.
From 3–0 to strike three
Jahmai Jones · third inning · one out, runner on second · game tied 0–0.
- 1Sweeper · 80.0 mph0–0 before · Ball · pitch 37
- 2Curveball · 73.9 mph1–0 before · Ball · pitch 38
- 3Sweeper · 77.6 mph2–0 before · Ball · pitch 39
- 4Cutter · 92.3 mph3–0 before · Swinging Strike · pitch 40
- 54-Seam Fastball · 95.5 mph3–1 before · Called Strike · pitch 41
- 6Sweeper · 80.1 mph3–2 before · Called Strike · pitch 42
The sweeper helped, but the takes mattered too
The sweeper generated 4 misses in 13 swings and finished 3 strikeouts. Abreu struck out on an 81.5 mph sweeper in the fourth after fouling off two sweepers and two sinkers. Nick Sogard missed a 78.6 mph sweeper on a full count in the fifth. These were earned finishes after Boston had extended the at-bats.
The full outing produced 9 misses in 48 swings, an 18.8% whiff rate. Fried also received 14 called strikes, and three of his six strikeouts were looking. The four-seamer finished two strikeouts, the sweeper three and the changeup one. The cutter had three misses and four called strikes, supplying useful steps in sequences even without finishing a strikeout itself.
Savant classifies 56 pitches outside its zone; Boston swung at 21 of them. On sweepers alone, the hitters offered at eight of 16 outside-zone pitches. Those takes and chases explain different parts of the result. A pitch taken for strike three counts just as much as a pitch swung through, but they are not the same evidence about how a hitter was beaten.
Contact brought both efficiency and a warning
Boston put 15 balls in play against Fried. They averaged 85.3 mph off the bat, with 3 meeting Statcast’s 95 mph hard-hit threshold. He recorded nine outs in the air and three on the ground, alongside the six strikeouts. This was not a ground-ball-heavy version of his work.
The seven-pitch second inning provided his quickest passage. Ceddanne Rafaela grounded out on a cutter, Caleb Durbin flew out on a changeup and Sogard flew out on another cutter. Durbin’s 95.6 mph contact and Sogard’s 97.2 mph contact both exceeded the hard-hit threshold, but their launch angles were 30 and 43 degrees. Contact speed alone did not determine the outcome.
The opposite complication appeared in the third: Eaton’s double left the bat at only 70.4 mph. A softly struck ball can still become an extra-base hit. Across all 15 balls in play, the displayed Statcast hit-probability estimates add to approximately 3.3 expected hits, compared with three actual hits. That sum uses rounded individual estimates; it is not an official aggregate statistic or proof that defense and positioning were irrelevant.
Contreras supplied the sharpest warning. With two outs in the sixth, Fried fell behind him 2–0 on sweepers and then threw four consecutive four-seamers. Contreras drove the fourth, a 95.9 mph pitch on a full count, out to right-center at 102.6 mph. The home-run call survived review, and a two-run lead became one. Contreras had reached in all three plate appearances: single, walk, homer.
Six innings required recovery, not constant control
Fried opened only 9 of 22 plate appearances with a strike or ball in play. He threw 21 pitches in both the first and fourth innings. The opening Jones and Rutschman strikeouts alone took 16 pitches. Boston’s 24 fouls repeatedly required another answer, even when an at-bat eventually ended in an out.
His four-seamer averaged 95.5 mph overall, about 0.7 mph above the regular-season baseline, and reached 97.9. It averaged 96.4 mph on eight first-inning pitches and 94.9 on seven in the sixth. There was no four-seamer in the second, and the third and fourth had just one each. The later decrease is visible; the small inning samples and the pitch record do not establish fatigue or injury.
Six complete innings, 98 pitches
Separate, aligned panels show cumulative workload and four-seam velocity by inning.
After Contreras’s homer, Fried needed two pitches to get Abreu to fly out on a cutter. He finished the sixth with the bases empty at 98 pitches. There was no inherited runner left for the bullpen to resolve. Boston’s second run came later and was not charged to him.
The next question is whether this sweeper-heavy balance continues against a different lineup. More sweepers to right-handers, fewer sinkers and another set of takes on well-placed secondary pitches would strengthen the case that this mix can travel. One outing does not establish that. What Game 2 does show is that Fried could change the balance of a broad repertoire, recover from unfavorable counts and keep a narrow lead intact without needing a large total of missed bats.
For the previous game’s contrasting mix of velocity and breaking balls, read the complete Cam Schlittler Game 1 breakdown. For another example of a changed pitch mix, Tyler Mahle’s Game 2 analysis examines a start built around the splitter.
All 98 pitches
Search by hitter, inning and pitch. Select a pitch number to inspect its measurements. Counts are before the pitch; the last column describes the whole plate appearance.
98 of 98 pitches
No matching pitches. Reset or change a filter.
| No. | Inn. | Hitter | Count | Pitch | mph | IVB (in.) | Pitch result | PA result |
|---|---|---|---|---|---|---|---|---|
| 1 | Jahmai Jones | 0-0 | 4-Seam Fastball | 95.5 | +16.3 | Ball | Strikeout | |
| 1 | Jahmai Jones | 1-0 | Cutter | 92.8 | +13.0 | Swinging Strike | Strikeout | |
| 1 | Jahmai Jones | 1-1 | Curveball | 73.7 | -13.6 | Ball | Strikeout | |
| 1 | Jahmai Jones | 2-1 | Cutter | 92.1 | +8.8 | Ball | Strikeout | |
| 1 | Jahmai Jones | 3-1 | Cutter | 92.2 | +10.3 | Foul | Strikeout | |
| 1 | Jahmai Jones | 3-2 | 4-Seam Fastball | 96.5 | +13.8 | Called Strike | Strikeout | |
| 1 | Adley Rutschman | 0-0 | Curveball | 74.5 | -17.5 | Ball | Strikeout | |
| 1 | Adley Rutschman | 1-0 | Sweeper | 79.5 | -8.3 | Called Strike | Strikeout | |
| 1 | Adley Rutschman | 1-1 | 4-Seam Fastball | 97.9 | +15.8 | Foul | Strikeout | |
| 1 | Adley Rutschman | 1-2 | 4-Seam Fastball | 96.8 | +15.8 | Foul | Strikeout | |
| 1 | Adley Rutschman | 1-2 | Sweeper | 82.4 | -7.0 | Ball | Strikeout | |
| 1 | Adley Rutschman | 2-2 | Sweeper | 81.0 | -11.2 | Foul | Strikeout | |
| 1 | Adley Rutschman | 2-2 | Cutter | 92.6 | +2.9 | Foul | Strikeout | |
| 1 | Adley Rutschman | 2-2 | 4-Seam Fastball | 96.2 | +15.6 | Ball | Strikeout | |
| 1 | Adley Rutschman | 3-2 | Sweeper | 81.4 | -4.3 | Foul | Strikeout | |
| 1 | Adley Rutschman | 3-2 | Changeup | 87.5 | +2.2 | Called Strike | Strikeout | |
| 1 | Willson Contreras | 0-0 | 4-Seam Fastball | 95.6 | +16.8 | Ball | Single | |
| 1 | Willson Contreras | 1-0 | 4-Seam Fastball | 96.2 | +16.9 | In play, no out | Single | |
| 1 | Wilyer Abreu | 0-0 | 4-Seam Fastball | 96.5 | +17.9 | Called Strike | Flyout | |
| 1 | Wilyer Abreu | 0-1 | Sweeper | 80.3 | -7.0 | Swinging Strike | Flyout | |
| 1 | Wilyer Abreu | 0-2 | Sweeper | 81.3 | -7.3 | In play, out(s) | Flyout | |
| 2 | Ceddanne Rafaela | 0-0 | Cutter | 91.9 | +11.4 | Called Strike | Groundout | |
| 2 | Ceddanne Rafaela | 0-1 | Cutter | 90.8 | +6.5 | In play, out(s) | Groundout | |
| 2 | Caleb Durbin | 0-0 | Cutter | 90.6 | +9.4 | Called Strike | Flyout | |
| 2 | Caleb Durbin | 0-1 | Changeup | 85.7 | +5.0 | In play, out(s) | Flyout | |
| 2 | Nick Sogard | 0-0 | Curveball | 74.2 | -15.2 | Foul | Flyout | |
| 2 | Nick Sogard | 0-1 | Sweeper | 79.9 | -8.3 | Called Strike | Flyout | |
| 2 | Nick Sogard | 0-2 | Cutter | 93.1 | +9.8 | In play, out(s) | Flyout | |
| 3 | Trevor Story | 0-0 | Curveball | 73.8 | -20.2 | Ball | Groundout | |
| 3 | Trevor Story | 1-0 | Curveball | 72.8 | -16.2 | Called Strike | Groundout | |
| 3 | Trevor Story | 1-1 | Changeup | 84.3 | +1.0 | Foul | Groundout | |
| 3 | Trevor Story | 1-2 | Sweeper | 81.2 | -13.6 | Foul | Groundout | |
| 3 | Trevor Story | 1-2 | Changeup | 88.6 | +6.7 | In play, out(s) | Groundout | |
| 3 | Nate Eaton | 0-0 | Sinker | 91.9 | +0.7 | Ball | Double | |
| 3 | Nate Eaton | 1-0 | Cutter | 90.2 | +7.8 | Foul | Double | |
| 3 | Nate Eaton | 1-1 | Changeup | 85.1 | +6.0 | In play, no out | Double | |
| 3 | Jahmai Jones | 0-0 | Sweeper | 80.0 | -6.8 | Ball | Strikeout | |
| 3 | Jahmai Jones | 1-0 | Curveball | 73.9 | -18.2 | Ball | Strikeout | |
| 3 | Jahmai Jones | 2-0 | Sweeper | 77.6 | -6.0 | Ball | Strikeout | |
| 3 | Jahmai Jones | 3-0 | Cutter | 92.3 | +7.1 | Swinging Strike | Strikeout | |
| 3 | Jahmai Jones | 3-1 | 4-Seam Fastball | 95.5 | +16.2 | Called Strike | Strikeout | |
| 3 | Jahmai Jones | 3-2 | Sweeper | 80.1 | -6.7 | Called Strike | Strikeout | |
| 3 | Adley Rutschman | 0-0 | Changeup | 85.0 | +3.1 | Ball | Groundout | |
| 3 | Adley Rutschman | 1-0 | Changeup | 86.9 | +1.2 | In play, out(s) | Groundout | |
| 4 | Willson Contreras | 0-0 | Cutter | 91.0 | +7.2 | Foul | Walk | |
| 4 | Willson Contreras | 0-1 | Cutter | 91.4 | +5.8 | Ball | Walk | |
| 4 | Willson Contreras | 1-1 | Changeup | 85.0 | +5.3 | Ball | Walk | |
| 4 | Willson Contreras | 2-1 | Cutter | 91.2 | +8.3 | Ball | Walk | |
| 4 | Willson Contreras | 3-1 | Cutter | 90.8 | +10.2 | Ball | Walk | |
| 4 | Wilyer Abreu | 0-0 | Cutter | 92.0 | +7.1 | Called Strike | Strikeout | |
| 4 | Wilyer Abreu | 0-1 | Sinker | 93.8 | +4.8 | Foul | Strikeout | |
| 4 | Wilyer Abreu | 0-2 | Sweeper | 80.5 | -9.8 | Foul | Strikeout | |
| 4 | Wilyer Abreu | 0-2 | Sweeper | 80.5 | -6.7 | Foul | Strikeout | |
| 4 | Wilyer Abreu | 0-2 | Sinker | 94.3 | +3.7 | Foul | Strikeout | |
| 4 | Wilyer Abreu | 0-2 | Sweeper | 81.5 | -2.6 | Swinging Strike | Strikeout | |
| 4 | Ceddanne Rafaela | 0-0 | Sweeper | 79.5 | -6.8 | Foul | Flyout | |
| 4 | Ceddanne Rafaela | 0-1 | Cutter | 93.4 | +8.6 | Swinging Strike | Flyout | |
| 4 | Ceddanne Rafaela | 0-2 | Cutter | 93.4 | +6.2 | Ball In Dirt | Flyout | |
| 4 | Ceddanne Rafaela | 1-2 | Cutter | 93.8 | +5.9 | In play, out(s) | Flyout | |
| 4 | Caleb Durbin | 0-0 | Sinker | 93.2 | +3.2 | Ball | Flyout | |
| 4 | Caleb Durbin | 1-0 | Cutter | 92.0 | +7.3 | Ball | Flyout | |
| 4 | Caleb Durbin | 2-0 | 4-Seam Fastball | 95.7 | +14.3 | Foul | Flyout | |
| 4 | Caleb Durbin | 2-1 | Sweeper | 76.9 | -6.8 | Ball | Flyout | |
| 4 | Caleb Durbin | 3-1 | Cutter | 91.8 | +4.6 | Foul | Flyout | |
| 4 | Caleb Durbin | 3-2 | Sweeper | 79.0 | -5.9 | In play, out(s) | Flyout | |
| 5 | Nick Sogard | 0-0 | Curveball | 73.2 | -18.2 | Ball | Strikeout | |
| 5 | Nick Sogard | 1-0 | Cutter | 91.3 | +8.5 | Ball | Strikeout | |
| 5 | Nick Sogard | 2-0 | Cutter | 91.0 | +10.0 | Called Strike | Strikeout | |
| 5 | Nick Sogard | 2-1 | 4-Seam Fastball | 94.2 | +15.6 | Foul | Strikeout | |
| 5 | Nick Sogard | 2-2 | Sweeper | 80.3 | -6.4 | Ball | Strikeout | |
| 5 | Nick Sogard | 3-2 | Sweeper | 78.6 | -6.4 | Swinging Strike | Strikeout | |
| 5 | Trevor Story | 0-0 | 4-Seam Fastball | 95.2 | +16.1 | Ball | Pop Out | |
| 5 | Trevor Story | 1-0 | 4-Seam Fastball | 94.5 | +17.6 | Swinging Strike | Pop Out | |
| 5 | Trevor Story | 1-1 | 4-Seam Fastball | 94.7 | +18.5 | Ball | Pop Out | |
| 5 | Trevor Story | 2-1 | Curveball | 73.5 | -16.0 | In play, out(s) | Pop Out | |
| 5 | Nate Eaton | 0-0 | Curveball | 72.6 | -13.6 | Called Strike | Strikeout | |
| 5 | Nate Eaton | 0-1 | Sweeper | 79.9 | -11.5 | Foul | Strikeout | |
| 5 | Nate Eaton | 0-2 | 4-Seam Fastball | 96.9 | +17.0 | Ball | Strikeout | |
| 5 | Nate Eaton | 1-2 | Curveball | 75.1 | -17.5 | Foul | Strikeout | |
| 5 | Nate Eaton | 1-2 | 4-Seam Fastball | 95.3 | +16.9 | Swinging Strike | Strikeout | |
| 6 | Jahmai Jones | 0-0 | Sweeper | 77.8 | +1.2 | Swinging Strike | Flyout | |
| 6 | Jahmai Jones | 0-1 | Changeup | 83.0 | +1.9 | Ball | Flyout | |
| 6 | Jahmai Jones | 1-1 | Changeup | 83.0 | +6.1 | Foul | Flyout | |
| 6 | Jahmai Jones | 1-2 | 4-Seam Fastball | 96.2 | +16.8 | Ball | Flyout | |
| 6 | Jahmai Jones | 2-2 | Sweeper | 79.4 | -5.0 | Ball | Flyout | |
| 6 | Jahmai Jones | 3-2 | Curveball | 72.8 | -14.6 | Foul | Flyout | |
| 6 | Jahmai Jones | 3-2 | 4-Seam Fastball | 95.1 | +13.8 | In play, out(s) | Flyout | |
| 6 | Adley Rutschman | 0-0 | Sinker | 92.3 | +1.2 | Ball | Flyout | |
| 6 | Adley Rutschman | 1-0 | Sinker | 90.9 | +2.3 | Ball | Flyout | |
| 6 | Adley Rutschman | 2-0 | 4-Seam Fastball | 94.0 | +18.8 | In play, out(s) | Flyout | |
| 6 | Willson Contreras | 0-0 | Sweeper | 78.4 | -0.1 | Ball | Home Run | |
| 6 | Willson Contreras | 1-0 | Sweeper | 78.0 | -5.9 | Ball | Home Run | |
| 6 | Willson Contreras | 2-0 | 4-Seam Fastball | 94.2 | +17.5 | Called Strike | Home Run | |
| 6 | Willson Contreras | 2-1 | 4-Seam Fastball | 94.7 | +18.5 | Ball | Home Run | |
| 6 | Willson Contreras | 3-1 | 4-Seam Fastball | 94.1 | +16.7 | Foul | Home Run | |
| 6 | Willson Contreras | 3-2 | 4-Seam Fastball | 95.9 | +15.6 | In play, run(s) | Home Run | |
| 6 | Wilyer Abreu | 0-0 | Sweeper | 81.7 | -2.9 | Ball | Flyout | |
| 6 | Wilyer Abreu | 1-0 | Cutter | 91.4 | +3.0 | In play, out(s) | Flyout |
Sources, definitions and limitations
MLB’s official Game 2 record supplies the final line, score, sequence and corrected calls. Baseball Savant’s complete gamefeed supplies pitch measurements; Statcast Search supplies the pregame regular-season baseline for pitcher 608331. Game date: September 30, 2026. Final record retrieved October 1 UTC (September 30 in Edmonton).
All 98 unique pitch identifiers, their order, pitch classifications and pre-pitch counts reconcile across the two feeds, as do 22 batters, 18 outs and six strikeouts. No missing speed, spin, extension, movement or location measurement was found among the 98 pitches; all 15 balls in play have exit speed, launch angle and expected batting average in the saved feed. Non-pitch timeouts and reviews are excluded. The first pitch of the third-inning Jones plate appearance was challenged and upheld as a ball.
Whiffs are misses divided by swings: swinging strikes, blocked swinging strikes, foul tips, fouls and balls in play. Foul tips follow the Savant-compatible miss convention; no foul tip or bunt occurred here. Nine misses in 48 swings gives 18.8%. Official strikes (62) also include 24 fouls, 14 called strikes and 15 balls in play. Chase uses Savant’s supplied zone flag: 21 swings on 56 outside-zone pitches. Strikeouts are assigned to completed plate appearances, not every two-strike event.
Baseline: 1,696 physical pitch records in 20 regular-season games, March 25–September 22, 2026; all are Fried’s, and the target game is excluded. All pitch types remain in the usage denominator, including 16 regular-season sliders. Induced vertical break (IVB) is movement relative to a gravity-only trajectory, not a claim that a ball rises. The CSV’s horizontal-break field retains Savant’s source convention and is not relabeled as arm-side movement. The location plot uses Savant plate_x/plate_z; these may differ slightly from MLB pX/pZ.
Expected hits on contact is an approximate sum of rounded gamefeed probabilities. No interview quote, stated intent, pitch-tunneling measurement, injury diagnosis or predictive model is claimed. Single-game rates describe this outing.