
MLB · Pitching Data
Logan Henderson Threw 20 Two-Strike Pitches in World Series Game 2’s First Inning
Milwaukee’s rookie reached two strikes against five of seven first-inning batters. Foul balls, extended counts and an error kept the inning going.
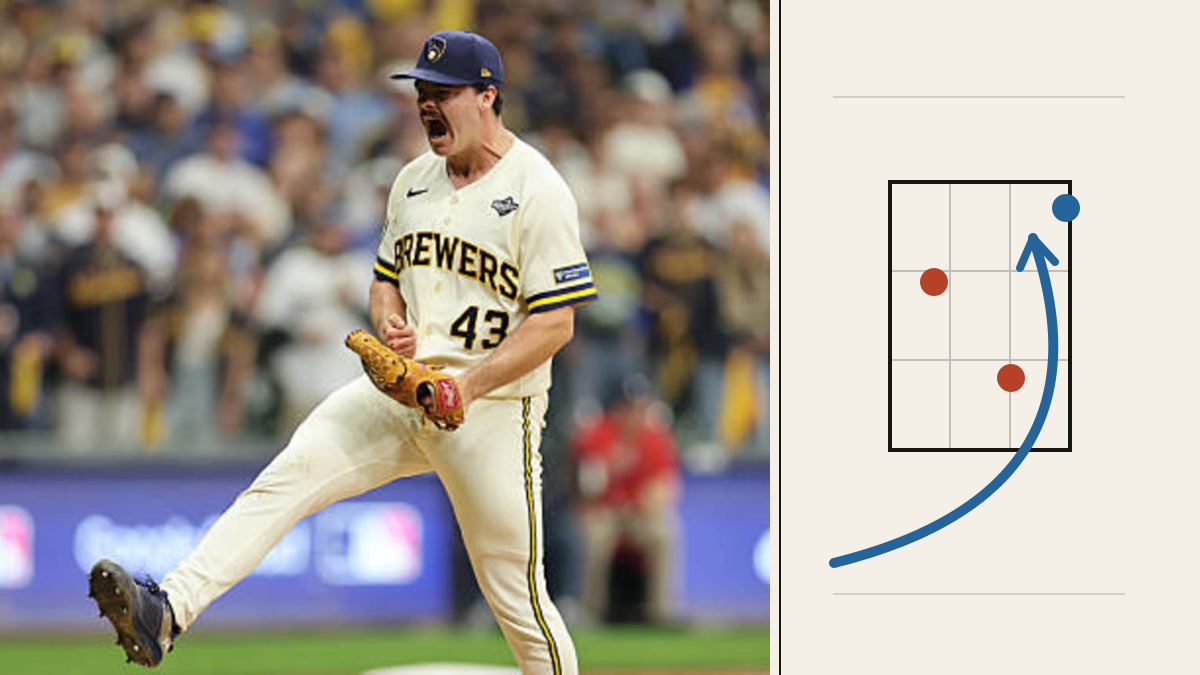
Logan Henderson had Yandy Díaz down 0–2 after two pitches in World Series Game 2. Five pitches later, Díaz reached on Cooper Pratt’s throwing error. Getting ahead had created a chance to finish the plate appearance, but it had produced neither a quick out nor a clean inning.
Henderson threw 35 pitches in that first inning against Tampa Bay on October 24, including 20 delivered with two strikes already on the hitter. The Brewers’ rookie allowed four runs, three earned, before completing three innings. Milwaukee eventually won 5–4. The official MLB game record shows why his early workload cannot be explained simply as a failure to throw strikes.
Two strikes did not end the confrontation
Five of the seven first-inning batters reached a two-strike count. Among Henderson’s 20 pitches thrown in those counts, eight were fouled off and seven were balls, including one in the dirt. Those 15 pitches prolonged the confrontation. Two produced swinging strikeouts; the other three went into play.
Junior Caminero provided the longest example. Henderson opened with two called changeup strikes, but Caminero’s plate appearance lasted nine pitches. He fouled off three subsequent two-strike offerings before singling on a full-count changeup to score Chandler Simpson. Díaz’s seven-pitch plate appearance and Caminero’s nine-pitch turn together consumed 16 of the inning’s 35 pitches.

| Inning | All pitches | With two strikes | Batters faced |
|---|---|---|---|
| 1 | 35 | 20 | 7 |
| 2 | 16 | 4 | 4 |
| 3 | 13 | 3 | 3 |
The damage was not all a two-strike problem
The first-inning error matters to the explanation. A ball put in play with two strikes became a baserunner through a defensive mistake. That outcome should not be described as a hit allowed by Henderson. Liam Hicks’s two-run homer, meanwhile, came on an 0–1 cutter, outside this study’s two-strike subset. Simpson’s RBI single also came before two strikes.
Henderson used 29 pitches across the next two innings, facing seven batters without allowing another hit. He still issued a leadoff walk in the second, and Taylor Walls advanced that runner with a sacrifice bunt. The smaller later workload therefore does not establish a sudden change in command or a new pitching strategy.
Across all three innings, nine of 14 batters reached two strikes and four struck out. The useful distinction is between earning that count and finishing it efficiently. The first inning supplied repeated opportunities to finish, but fouls, balls and a defensive error kept turning those opportunities into additional pitches.
Sample and method: this is a count-and-workload study of Henderson’s 64 physical pitches in Game 2, not a season trend or a full arsenal assessment. The comparison is between innings within that one start; opponent mix and plate-appearance outcomes differ. Counts are taken before each pitch from the final event sequence, retaining reviewed calls. Non-pitch events are excluded from pitch totals. Download the 64-pitch source ledger. Explore more Pitching Data studies.
Sources and notes
- MLB final World Series Game2 event record and boxscore — https://statsapi.mlb.com/api/v1.1/game/849802/feed/live
- MLB: Logan Henderson K’s four in World Series Game2 — https://www.mlb.com/video/logan-henderson-k-s-four-in-world-series-game-2