
MLB · Pitching Data
Aaron Ashby’s Three Strikeout Pitches Closed World Series Game 2
A changeup, slider and curveball supplied the final strikes. His sinker still did much of the work before those finishes.
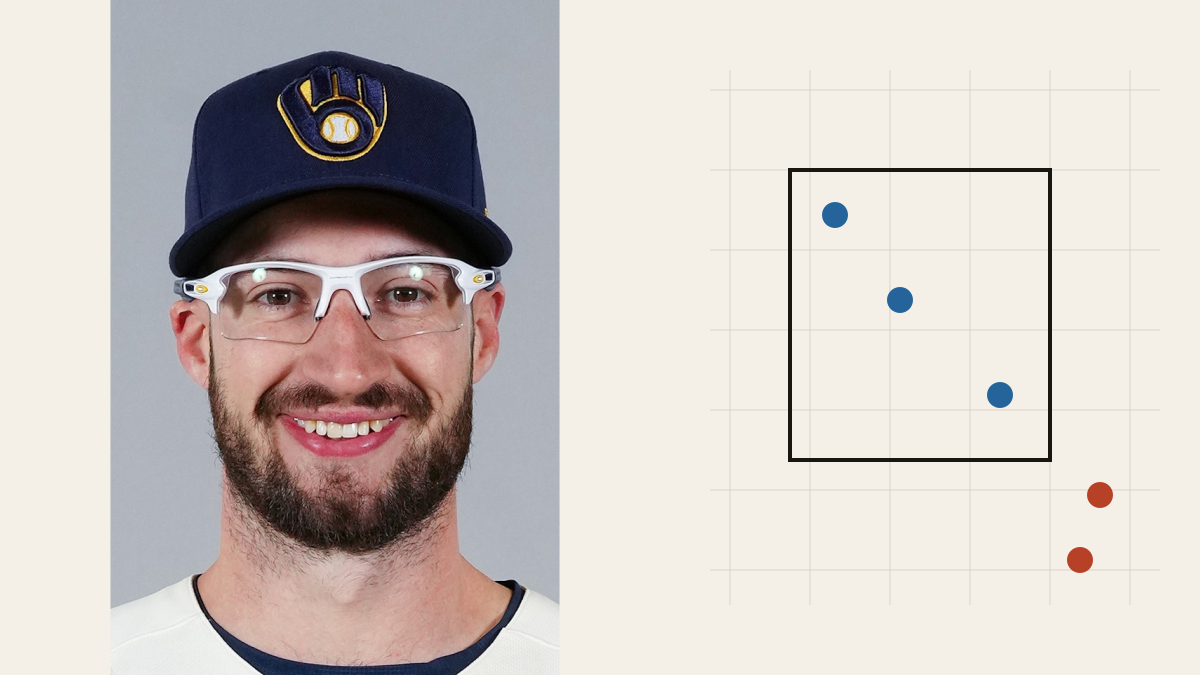
Aaron Ashby ended World Series Game 2 with a blocked curveball that Yandy Díaz swung through. Earlier, a changeup had finished Ryan Vilade and a slider had put away Victor Mesa Jr. Three different pitches supplied the final strikes of his three strikeouts.
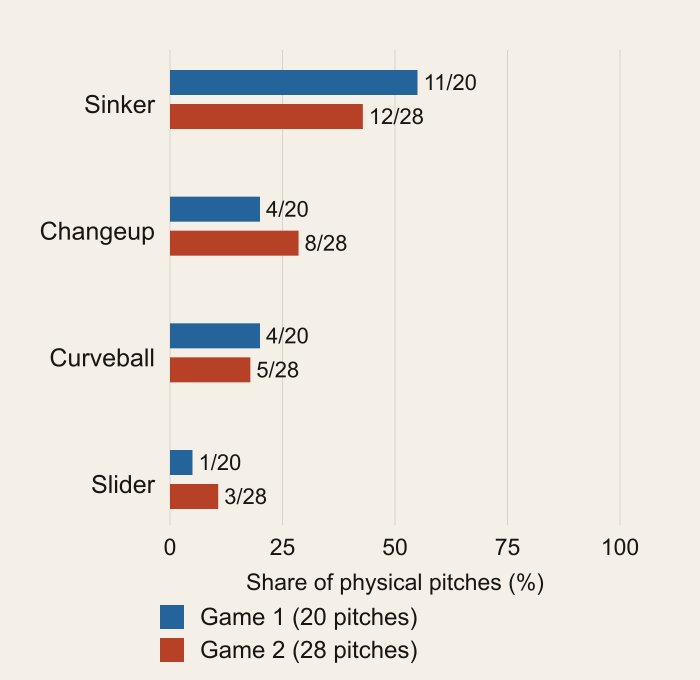
The five-out save secured Milwaukee’s 5–4 victory over Tampa Bay on October 24. It also illustrates why counting only strikeout pitches can miss much of a reliever’s work. Ashby’s sinker was his most-used pitch, accounting for 12 of 28 deliveries, even though it did not finish a strikeout.
The Sinker Stayed in the Sequence
Against Vilade in the eighth, Ashby threw three sinkers before the full-count changeup that produced the strikeout. Against Mesa in the ninth, a called sinker and a swinging miss on another sinker helped establish the two-strike count. The slider supplied the finish.
Díaz’s final plate appearance was different. Ashby started with a called sinker, missed with three changeups, then landed a curveball for a called strike. Another curveball ended the game. The record shows a recovery from a 3–1 count; it does not establish what Ashby intended or what Díaz anticipated.
| Pitch | Game 1 | Game 2 |
|---|---|---|
| Sinker | 11/20 (55.0%) | 12/28 (42.9%) |
| Changeup | 4/20 (20.0%) | 8/28 (28.6%) |
| Curveball | 4/20 (20.0%) | 5/28 (17.9%) |
| Slider | 1/20 (5.0%) | 3/28 (10.7%) |
A Broader Mix, With a Small-Sample Limit
In the preselected comparison, Ashby’s five outs in Game 1 took 20 pitches. Eleven were sinkers and four were changeups. Game 2’s 28 pitches included 12 sinkers and eight changeups. The changeup’s share increased from 20% to 28.6%, while the sinker’s share fell from 55% to 42.9%.
Those percentages need context. Ashby faced six batters rather than five, and right-handed hitters accounted for 21 of his 28 pitches, compared with nine of 20 in Game 1. Seven of the eight Game 2 changeups came in the plate appearances against Ben Williamson and Díaz. Longer encounters and a different distribution of hitters can move the overall mix without proving a new approach.
The ninth also supplied counterevidence to an account built entirely around missed bats. Jonny DeLuca doubled on a curveball, and Williamson’s groundout advanced him to third. Ashby finished with five misses in 11 swings, counting fouls and balls in play as swings, but contact and outs on the ground remained part of the save.
Sample and Method
This study compares only Ashby’s October 23 and 24 World Series appearances. MLB’s Game 1 record supplies the baseline. All 48 physical pitches reconcile to the official totals, and all have pitch-type labels. None was excluded. Blocked swinging strikes count as misses, while fouls are swings without misses. Download the two-appearance pitch sample (CSV). The comparison makes no season-trend, fatigue or command claim. See the wider TSP Pitching Data collection for other declared samples.
Sources and notes
- MLB official World Series Game 2 pitch record — https://statsapi.mlb.com/api/v1.1/game/849802/feed/live
- MLB official World Series Game 1 pitch record — https://statsapi.mlb.com/api/v1.1/game/849805/feed/live
- Aaron Ashby official MLB current portrait — https://img.mlbstatic.com/mlb-photos/image/upload/w_640,q_auto:best/v1/people/676879/headshot/67/current