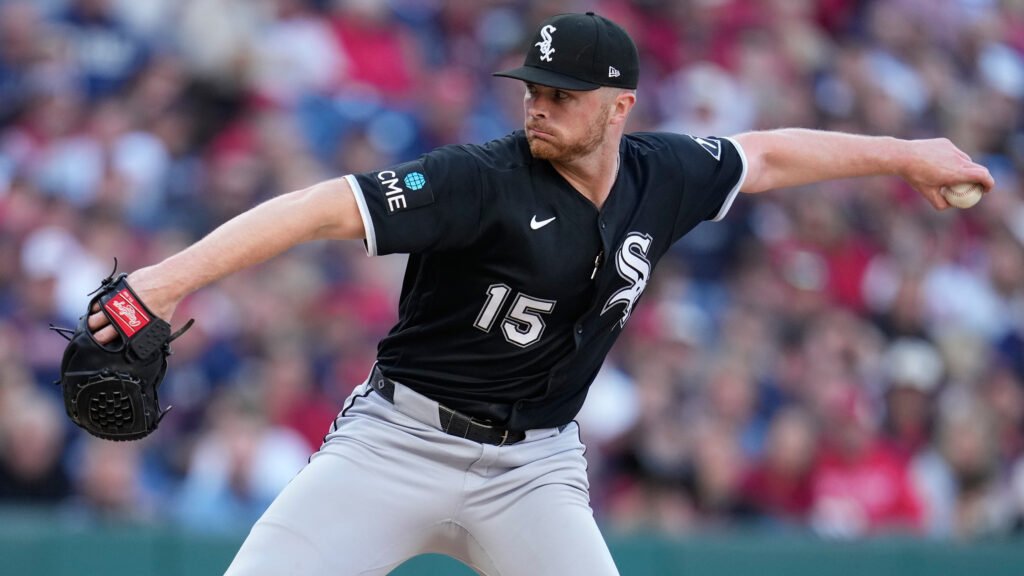
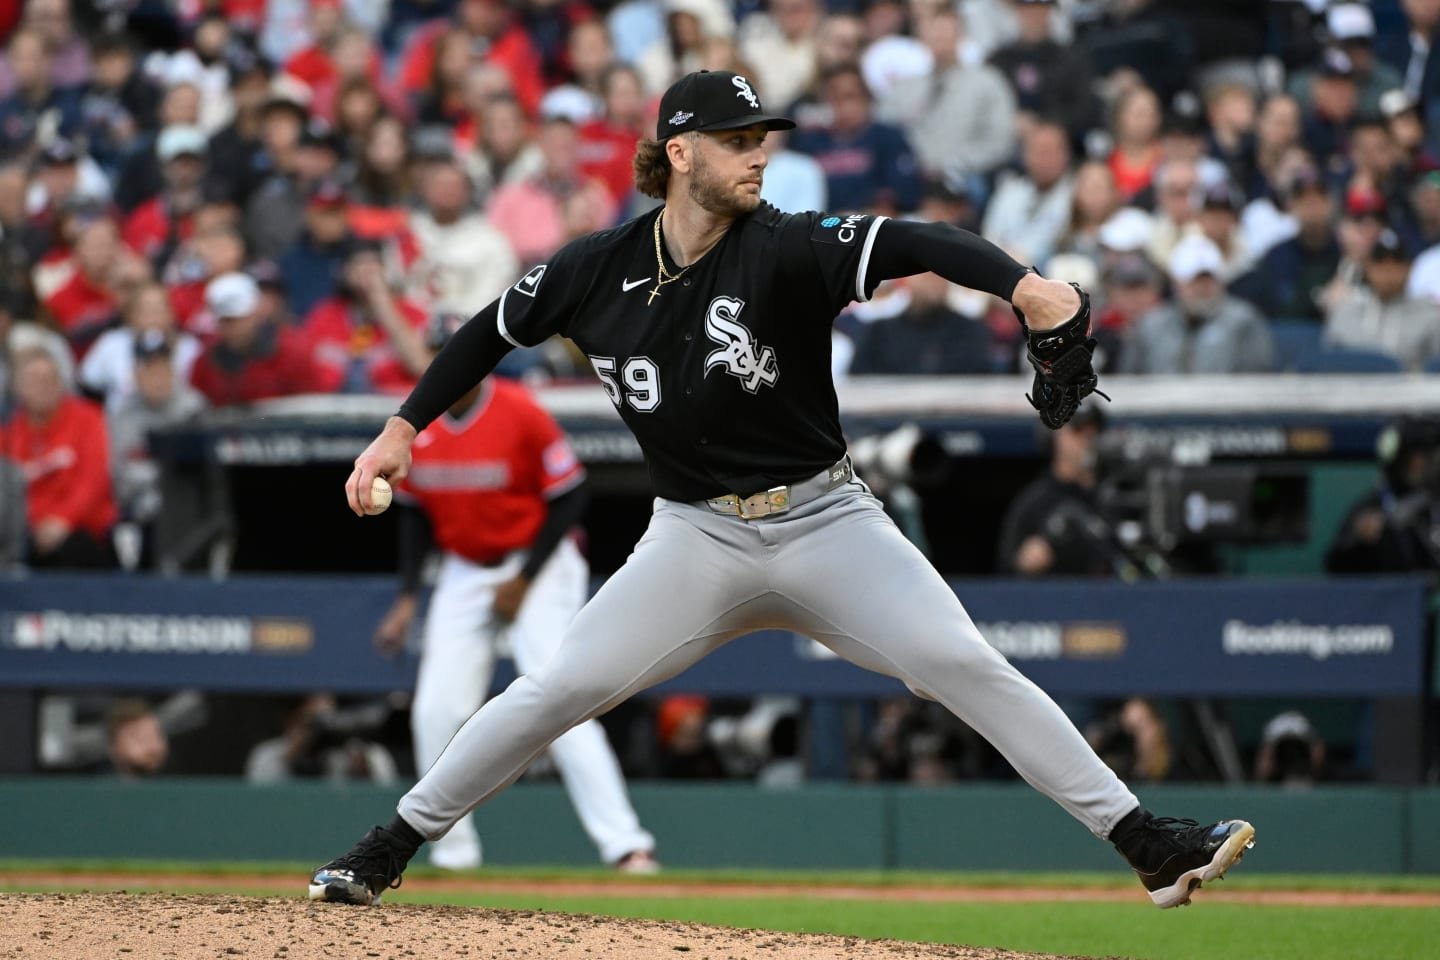
Sean Burke entered the third inning with Cleveland ahead 2-0, a runner at first and one out. Jo Adell swung through fastballs at 91.8 and 91.6 mph, fouled off a 92.9 mph fastball, then watched an 85.2 mph slider for strike three. Nathaniel Lowe followed with another strikeout. Burke had stranded the inherited runner before his first inning of work was complete.
Chicago's planned bulk pitcher ultimately supplied 5 1/3 innings in a 4-3 ALDS Game 2 win at Progressive Field on October 5. He allowed one hit, one walk and one run, struck out six and threw 83 pitches. His one charged run scored after he left in the eighth.
The result did not require unusually high average fastball speed or an entirely different arsenal. Burke combined fastball misses with early called strikes, then allowed the defense to finish a substantial share of his outs. His complete record shows both the useful sequences and the contact that complicates a simple dominance claim.
The biggest usage change needs a matchup check
Burke's four-seamer accounted for 39.8% of his pitches, close to its 37.1% share in a baseline of 2,878 physical pitches across 32 regular-season games, March 28 through September 25. Its 94.6 mph average was also close to the season's 94.8.
Cutter use rose to 16.9%, from 10.4%, while sliders and sinkers took smaller overall shares. The handedness split helps explain the size of that change. Left-handed batters accounted for 73 of Burke's 83 pitches, and all 14 cutters went to them.
Against left-handers, the cutter share was 19.2% rather than the season's 13.6%. The increase remained, but it was smaller within a comparable batting-side group. The evidence supports more cutters in these matchups, with the left-heavy opponent contributing to the whole-outing difference. It does not establish a new coaching intervention or a permanent repertoire change.
Pitch selection: regular season and Game 2
Share of all physical pitches. Scale: 0-40%.
Four-seam
Knuckle-curve
Cutter
Slider
Sinker
Changeup
The first relief sequence supplied a useful pattern
Adell's opening confrontation ended with a called slider after the fastball had produced two misses and a foul. Burke finished Lowe with a 94.3 mph fastball after mixing in two knuckle-curves, the tracking classification for his slower breaking ball.
The four-seamer produced seven of Burke's 11 misses, in 20 fastball swings. Across the outing he also collected 16 called strikes, and 13 of 18 plate appearances began with a recorded strike or contact. Those takes helped create opportunities to finish without requiring every useful pitch to miss a bat.
Against Adell again in the sixth, Burke opened with a called slider, threw a fastball for ball one, then returned to the slider for a called strike and a swinging strikeout. José Ramírez's two strikeouts ended differently: a blocked cutter miss in the fifth and a four-seam miss in the eighth. The ledger preserves each setup rather than crediting one pitch with the entire outing.
Jo Adell: inning 3
Thirteen straight outs included help on contact
After walking Travis Bazzana in the fourth, Burke retired 13 consecutive batters before Chase DeLauter's eighth-inning single. The run began with Patrick Bailey's flyout and ended with Ramírez's strikeout. It covered clean fifth, sixth and seventh innings and the first two outs of the eighth.
Burke allowed 11 balls in play, including four hit at least 95 mph. Bailey's 100.2 mph fly ball and Bazzana's 102.3 mph fly ball both became outs. Steven Kwan's 90.8 mph lineout in the eighth also required a catch. Those results make contact shape and defense part of the explanation, alongside Burke's six strikeouts.
He completed the seventh on only nine pitches. The longer fourth had cost 19, including the walk, but his cumulative workload was 68 after seven. That helped him reach the eighth without needing to turn every plate appearance into an extended strikeout chase.
His one run arrived after pitch 83
DeLauter took Burke from 0-2 to 2-2 in the eighth, then singled to left on a 95.3 mph fastball. Burke departed with Chicago ahead 4-2 and DeLauter at first. Jo Adell tripled against Grant Taylor to score DeLauter, narrowing the game to 4-3. That was the run charged to Burke.
His eighth-inning fastballs averaged 95.0 mph across five pitches, higher than the 93.2 average from his third-inning entry. The record does not support a simple late velocity-collapse explanation for the final hit. DeLauter's single left the bat at 84.9 mph, considerably softer than several earlier outs.
Burke's contribution was a long stretch of useful innings after an unsettled opening. A repeat outing should be judged on whether he can keep acquiring early strikes and combining fastball misses with manageable contact. One hit allowed is the result here; the complete ledger shows why that outcome also depended on where Cleveland's contact went.
Workload and four-seam speed by inning
| Inning | Pitches | Cumulative | Four-seam mph | Four-seam n | Outs recorded |
|---|---|---|---|---|---|
| 3* | 11 | 11 | 93.2 | 7 | 2 |
| 4 | 19 | 30 | 93.5 | 4 | 3 |
| 5 | 17 | 47 | 95.6 | 9 | 3 |
| 6 | 12 | 59 | 95.4 | 5 | 3 |
| 7 | 9 | 68 | 94.8 | 3 | 3 |
| 8* | 15 | 83 | 95.0 | 5 | 2 |
All 83 pitches
Filter the complete outing and select any pitch for its measurements. Pitch result and completed plate-appearance outcome are separate columns.
83 of 83 pitches
No pitches match these filters.
| Pitch | Inning | Hitter | Count before | Tracking type | mph | Pitch result | PA outcome |
|---|---|---|---|---|---|---|---|
| 3 | Jo Adell | 0-0 | Knuckle-curve | 75.0 | Ball | Strikeout | |
| 3 | Jo Adell | 1-0 | Four-seam | 91.8 | Swinging Strike | Strikeout | |
| 3 | Jo Adell | 1-1 | Four-seam | 93.6 | Ball | Strikeout | |
| 3 | Jo Adell | 2-1 | Four-seam | 91.6 | Swinging Strike | Strikeout | |
| 3 | Jo Adell | 2-2 | Four-seam | 92.9 | Foul | Strikeout | |
| 3 | Jo Adell | 2-2 | Slider | 85.2 | Called Strike | Strikeout | |
| 3 | Nathaniel Lowe | 0-0 | Knuckle-curve | 74.7 | Foul | Strikeout | |
| 3 | Nathaniel Lowe | 0-1 | Four-seam | 94.1 | Swinging Strike | Strikeout | |
| 3 | Nathaniel Lowe | 0-2 | Four-seam | 93.9 | Foul | Strikeout | |
| 3 | Nathaniel Lowe | 0-2 | Knuckle-curve | 78.4 | Ball In Dirt | Strikeout | |
| 3 | Nathaniel Lowe | 1-2 | Four-seam | 94.3 | Swinging Strike | Strikeout | |
| 4 | Angel Martínez | 0-0 | Knuckle-curve | 73.9 | Called Strike | Lineout | |
| 4 | Angel Martínez | 0-1 | Four-seam | 93.2 | Ball | Lineout | |
| 4 | Angel Martínez | 1-1 | Four-seam | 93.3 | Foul | Lineout | |
| 4 | Angel Martínez | 1-2 | Knuckle-curve | 77.1 | Ball | Lineout | |
| 4 | Angel Martínez | 2-2 | Four-seam | 93.7 | Foul | Lineout | |
| 4 | Angel Martínez | 2-2 | Slider | 86.7 | Ball | Lineout | |
| 4 | Angel Martínez | 3-2 | Sinker | 95.5 | In play, out(s) | Lineout | |
| 4 | Travis Bazzana | 0-0 | Cutter | 88.9 | Ball | Walk | |
| 4 | Travis Bazzana | 1-0 | Knuckle-curve | 76.9 | Ball | Walk | |
| 4 | Travis Bazzana | 2-0 | Cutter | 88.2 | Ball | Walk | |
| 4 | Travis Bazzana | 3-0 | Four-seam | 93.8 | Called Strike | Walk | |
| 4 | Travis Bazzana | 3-1 | Slider | 85.8 | Ball | Walk | |
| 4 | Patrick Bailey | 0-0 | Cutter | 88.1 | Called Strike | Flyout | |
| 4 | Patrick Bailey | 0-1 | Cutter | 90.1 | In play, out(s) | Flyout | |
| 4 | Brayan Rocchio | 0-0 | Knuckle-curve | 78.2 | Ball In Dirt | Flyout | |
| 4 | Brayan Rocchio | 1-0 | Slider | 86.7 | Ball | Flyout | |
| 4 | Brayan Rocchio | 2-0 | Knuckle-curve | 78.3 | Ball In Dirt | Flyout | |
| 4 | Brayan Rocchio | 3-0 | Sinker | 94.6 | Foul | Flyout | |
| 4 | Brayan Rocchio | 3-1 | Sinker | 95.0 | In play, out(s) | Flyout | |
| 5 | Steven Kwan | 0-0 | Cutter | 86.7 | Called Strike | Groundout | |
| 5 | Steven Kwan | 0-1 | Four-seam | 94.6 | Ball | Groundout | |
| 5 | Steven Kwan | 1-1 | Four-seam | 93.2 | Called Strike | Groundout | |
| 5 | Steven Kwan | 1-2 | Four-seam | 95.0 | Foul | Groundout | |
| 5 | Steven Kwan | 1-2 | Knuckle-curve | 80.1 | In play, out(s) | Groundout | |
| 5 | José Ramírez | 0-0 | Four-seam | 94.3 | Called Strike | Strikeout | |
| 5 | José Ramírez | 0-1 | Cutter | 90.8 | Ball | Strikeout | |
| 5 | José Ramírez | 1-1 | Four-seam | 95.5 | Foul | Strikeout | |
| 5 | José Ramírez | 1-2 | Knuckle-curve | 79.3 | Foul | Strikeout | |
| 5 | José Ramírez | 1-2 | Cutter | 88.3 | Swinging Strike (Blocked) | Strikeout | |
| 5 | Chase DeLauter | 0-0 | Sinker | 96.6 | Foul | Groundout | |
| 5 | Chase DeLauter | 0-1 | Four-seam | 96.5 | Foul | Groundout | |
| 5 | Chase DeLauter | 0-2 | Four-seam | 98.5 | Ball | Groundout | |
| 5 | Chase DeLauter | 1-2 | Cutter | 88.3 | Ball | Groundout | |
| 5 | Chase DeLauter | 2-2 | Knuckle-curve | 80.3 | Foul | Groundout | |
| 5 | Chase DeLauter | 2-2 | Four-seam | 95.8 | Foul | Groundout | |
| 5 | Chase DeLauter | 2-2 | Four-seam | 96.7 | In play, out(s) | Groundout | |
| 6 | Jo Adell | 0-0 | Slider | 85.7 | Called Strike | Strikeout | |
| 6 | Jo Adell | 0-1 | Four-seam | 93.7 | Ball | Strikeout | |
| 6 | Jo Adell | 1-1 | Slider | 87.0 | Called Strike | Strikeout | |
| 6 | Jo Adell | 1-2 | Slider | 86.9 | Swinging Strike | Strikeout | |
| 6 | Nathaniel Lowe | 0-0 | Cutter | 89.1 | Called Strike | Groundout | |
| 6 | Nathaniel Lowe | 0-1 | Knuckle-curve | 77.9 | Ball | Groundout | |
| 6 | Nathaniel Lowe | 1-1 | Four-seam | 94.3 | Ball | Groundout | |
| 6 | Nathaniel Lowe | 2-1 | Cutter | 89.9 | In play, out(s) | Groundout | |
| 6 | Angel Martínez | 0-0 | Sinker | 94.7 | Ball | Strikeout | |
| 6 | Angel Martínez | 1-0 | Four-seam | 95.1 | Foul | Strikeout | |
| 6 | Angel Martínez | 1-1 | Four-seam | 95.9 | Swinging Strike | Strikeout | |
| 6 | Angel Martínez | 1-2 | Four-seam | 97.8 | Swinging Strike | Strikeout | |
| 7 | Travis Bazzana | 0-0 | Cutter | 88.3 | Called Strike | Flyout | |
| 7 | Travis Bazzana | 0-1 | Slider | 85.5 | Ball | Flyout | |
| 7 | Travis Bazzana | 1-1 | Four-seam | 94.8 | Called Strike | Flyout | |
| 7 | Travis Bazzana | 1-2 | Cutter | 88.1 | Ball | Flyout | |
| 7 | Travis Bazzana | 2-2 | Four-seam | 94.8 | In play, out(s) | Flyout | |
| 7 | Patrick Bailey | 0-0 | Knuckle-curve | 76.7 | In play, out(s) | Groundout | |
| 7 | Brayan Rocchio | 0-0 | Sinker | 95.9 | Ball | Flyout | |
| 7 | Brayan Rocchio | 1-0 | Slider | 85.5 | Called Strike | Flyout | |
| 7 | Brayan Rocchio | 1-1 | Four-seam | 94.9 | In play, out(s) | Flyout | |
| 8 | Steven Kwan | 0-0 | Sinker | 94.3 | Called Strike | Lineout | |
| 8 | Steven Kwan | 0-1 | Four-seam | 94.5 | Ball | Lineout | |
| 8 | Steven Kwan | 1-1 | Slider | 86.7 | Ball | Lineout | |
| 8 | Steven Kwan | 2-1 | Cutter | 87.3 | Swinging Strike | Lineout | |
| 8 | Steven Kwan | 2-2 | Sinker | 95.1 | In play, out(s) | Lineout | |
| 8 | José Ramírez | 0-0 | Knuckle-curve | 76.6 | Called Strike | Strikeout | |
| 8 | José Ramírez | 0-1 | Four-seam | 94.6 | Ball | Strikeout | |
| 8 | José Ramírez | 1-1 | Cutter | 88.8 | Foul | Strikeout | |
| 8 | José Ramírez | 1-2 | Knuckle-curve | 79.9 | Ball | Strikeout | |
| 8 | José Ramírez | 2-2 | Four-seam | 94.0 | Swinging Strike | Strikeout | |
| 8 | Chase DeLauter | 0-0 | Knuckle-curve | 76.5 | Swinging Strike | Single | |
| 8 | Chase DeLauter | 0-1 | Knuckle-curve | 77.4 | Called Strike | Single | |
| 8 | Chase DeLauter | 0-2 | Four-seam | 96.7 | Ball | Single | |
| 8 | Chase DeLauter | 1-2 | Knuckle-curve | 78.5 | Ball | Single | |
| 8 | Chase DeLauter | 2-2 | Four-seam | 95.3 | In play, no out | Single |
Sources, definitions and limitations
The official MLB game record supplies the final score, pitching line and event order. Baseball Savant gamefeed supplies pitch measurements. Statcast Search supplies the regular-season comparison for pitcher 680732. Reporting cutoff: October 6, 2026, 11:30 AM Mountain Time; October 5 game final.
All 83 physical pitches reconcile by unique ID, order and pre-pitch count, with classification comparisons described below, as do 18 batters, 16 recorded outs and 6 strikeouts. Non-pitch actions and automatic calls are excluded from physical-pitch totals. Final plate-appearance outcomes remain separate from individual calls. One tracking-feed label in this outing shortened a blocked swinging strike. The ledger retains the official MLB blocked description; swing and miss totals are unchanged.
Baseline: 2,878 physical pitches in 32 regular-season games, 2026-03-28 through 2026-09-25; target game excluded. No type is removed from pitch-share denominators. Whiff rate means misses divided by swings. Swinging strikes, blocked swinging strikes and foul tips count as misses; swings also include fouls, balls in play and any bunt attempts. Counts accompany small samples. Chase uses the supplied zone flag. The location chart uses catcher-view plate_x and plate_z in feet and the batter’s recorded zone. Statcast documentation defines 2026 location fields at mid-plate and zone boundaries under ABS.
Release speed is in mph; spin is rpm; extension is feet. Induced vertical break, in inches, measures movement relative to a gravity-only path and does not imply that the ball rises. Horizontal movement in the CSV retains the source’s catcher-view signed convention. All outing pitches have speed, spin, extension, movement, location and zone measurements. All 11 balls in play have exit speed; 0 lack launch angle. Missing fields remain blank. Expected batting averages are per-ball rounded tracking estimates, not official aggregate results; this article does not sum them into a predictive claim.
Game rates describe one outing. Pitch selection, measured locations and velocity cannot establish intended targets, hitter expectations, fatigue or injury. Photo credits and source links identify the images.