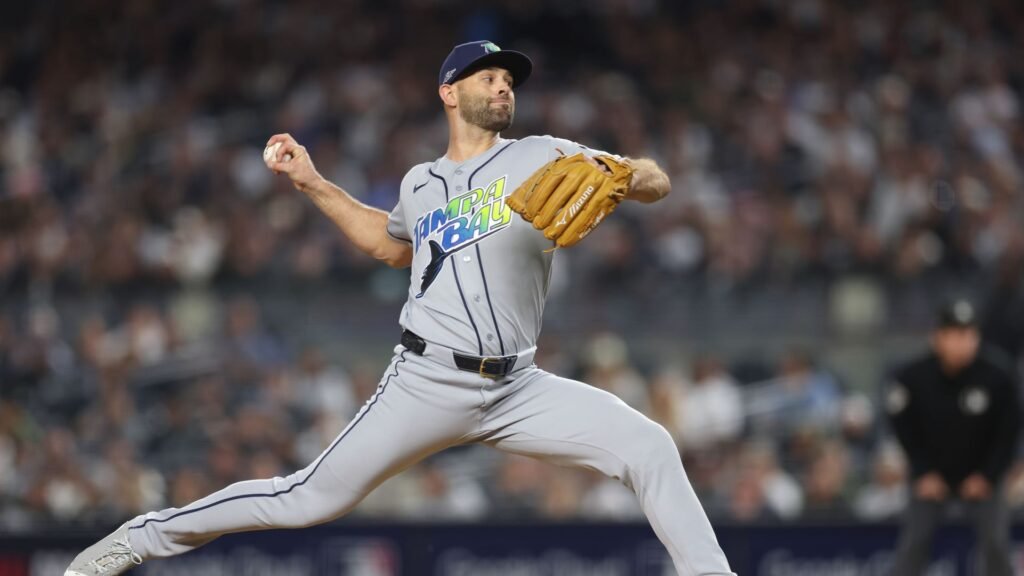
Freddie Freeman missed Chris Sale’s first sinker in the fourth inning, a 97.7 mph pitch outside the recorded strike zone. Sale threw another sinker, this one 95.7 mph and also classified outside by Baseball Savant. Freeman hit it at 103.2 mph and a 34-degree launch angle for a home run to right-center. Getting a hitter to swing outside the zone had produced two very different results in two pitches.
The homer made the Dodgers’ lead 3–0. Sale finished NLDS Game 3 at Truist Park with three earned runs on seven hits over five innings, seven strikeouts, no walks and 95 pitches. Los Angeles won 3–1 on October 6 and took a 2–1 series lead.
Sale’s fastball was faster than his regular-season average, and the slider remained a useful strikeout pitch. The complete record nevertheless shows repeated contact: 16 balls in play, 10 at 95 mph or harder. Both homers came on pitches other than the four-seamer. Explaining the loss requires looking beyond the strikeout total and beyond the two swings that cleared the fence.

A familiar mix with more speed
Sale threw 41 four-seamers and 40 sliders, respectively 43.2% and 42.1% of the outing. Their season shares were 41.4% and 39.9%. The sinker stayed close to its normal share at 8.4%, while the changeup fell from 10.3% to 6.3%, six pitches. This was largely the established fastball-slider approach, rather than a wholesale repertoire change.
The comparison uses 2,574 physical pitches in all 27 regular-season starts, March 27 through September 23, and matches the official pitch total. It excludes both this game and Sale’s earlier postseason work. The four-seamer averaged 97.2 mph against Los Angeles, compared with 96.1 in the season sample, and reached 100.3. The slider averaged 80.2 mph, compared with 79.8.
Sale’s batting-side distribution was also fairly familiar. Right-handed hitters saw 67 of his 95 pitches, 70.5%, compared with 75.6% of the regular-season sample. He threw all eight sinkers to left-handers and all six changeups to right-handers. Those six changeups are a small sample; the homer on one of them does not establish that abandoning the pitch would have improved the outing.
Pitch selection: regular season and Game 3
Share of all physical pitches. Scale: 0-50%.
Four-seam
Slider
Sinker
Changeup
Six early strikeouts did not make the innings short
Sale struck out three hitters in each of the first two innings. The slider finished four of those six strikeouts, and the four-seamer finished two. Against Ohtani in the first, he used four sliders around a 98.9 mph sinker: a miss, a ball, the sinker for a called strike, another ball and an 82.9 mph slider for the strikeout.
The work still required 42 pitches to record the first six outs. Betts singled to open the first, Teoscar Hernández reached on Ha-Seong Kim’s fielding error and Tucker singled in the second. Sale had no walk, but strikeouts and baserunners extended his path through the lineup.
The slider generated seven misses in 17 swings across the full outing and finished five strikeouts. The four-seamer generated only two misses in 21 swings, even while providing 10 called strikes. Sale’s final strikeout came in the fifth, when Smith fouled off two fastballs before missing an 82.2 mph slider below the recorded zone. The breaking ball continued to work after the scoring inning.
Contact was already accumulating before the home runs
The Dodgers put five balls in play during the third, an inning in which Sale produced no miss in eight swings. Betts and Smith singled, Freeman hit a 101.3 mph flyout and Teoscar Hernández hit a 103.2 mph flyout. Ohtani reached on catcher interference before Rojas lined out with the bases loaded. Sale kept the game scoreless, but the lack of a run did not mean the contact had disappeared.
For the full outing, Sale’s 10 hard-hit balls came from 16 balls in play, a 62.5% rate. His regular-season comparison was 141 of 402 measured balls, 35.1%. Game 3 contact averaged 97.9 mph, compared with 87.5 during the season. Sixteen balls are not a stable estimate of his future contact quality, but the damage was spread across more than the two home runs.
The four-seamer accounts for much of that traffic. It produced 10 balls in play, seven of them hard-hit, averaging 98.2 mph off the bat. It did not allow a home run. Its difficulty was that Los Angeles repeatedly put it into play, including hard-hit grounders and flyouts that kept innings active or depended on fielders completing the outs.
Two secondary pitches supplied the decisive damage
Pages opened the fourth with a 102.8 mph single on a four-seamer. Tucker lined out before Enrique Hernández saw two changeups. The first, 92.1 mph, was a ball; the second, 88.9, finished inside the recorded zone near its lower boundary. Hernández hit it 106.8 mph at 33 degrees for a two-run homer to left.
After Betts grounded out, Freeman’s two-sinker at-bat added the third run. The first pitch induced a miss and the second became a homer even though both were classified outside the zone. That is a useful limit on a chase-rate explanation: an outside-zone swing can be damaging contact. The measured locations alone also cannot tell us whether Sale missed an intended target.
Teoscar Hernández then hit an 80.2 mph slider at 108.4 mph and 21 degrees, but Dubón caught it in left. The fourth ended with five hard-hit balls among six balls in play. A hitter’s failure to reach safely is not the same as a pitcher avoiding hard contact, just as Freeman’s homer does not make all eight sinkers unsuccessful.
Freddie Freeman: inning 4
The last inning could not reverse the earlier cost
Sale had thrown 62 pitches through three innings and 80 through four. His fifth took 15 more: Smith struck out, Ohtani flew out and Rojas grounded out. It was his only inning without a baserunner, although the last two outs left the bat at 101.3 and 97.7 mph. He departed with the bases empty and no inherited runner; all three runs charged to him had scored in the fourth.
His four-seamer averaged 97.6 mph on eight pitches in the first, reached an inning average of 97.8 on nine in the third and averaged 96.4 on nine in the fifth. Even the last inning remained slightly above the full-season average. The inning samples show changing speed, but they do not establish that fatigue caused the contact or the home runs.
Sale finished with 10 misses in 44 swings, a 22.7% whiff rate, compared with 395 in 1,304 swings, 30.3%, during the season. His seven strikeouts were real evidence of pitches that worked, especially the slider. They were not a complete description of the other plate appearances.
In a later start, the useful test is whether the four-seamer again produces frequent contact despite its speed, and whether those balls remain this hard-hit. Game 3 supports a specific explanation: the slider supplied strikeouts, while sustained contact lengthened Sale’s work and two secondary-pitch home runs supplied the scoring. Extra velocity did not prevent either part of that result.
Workload and four-seam speed by inning
| Inning | Pitches | Cumulative | Four-seam mph | Four-seam n | Outs recorded |
|---|---|---|---|---|---|
| 1 | 24 | 24 | 97.6 | 8 | 3 |
| 2 | 18 | 42 | 96.9 | 7 | 3 |
| 3 | 20 | 62 | 97.8 | 9 | 3 |
| 4 | 18 | 80 | 97.2 | 8 | 3 |
| 5 | 15 | 95 | 96.4 | 9 | 3 |
All 95 pitches
Filter the complete outing and select any pitch for its measurements. Pitch result and completed plate-appearance outcome are separate columns.
95 of 95 pitches
No pitches match these filters.
| Pitch | Inning | Hitter | Count before | Type | mph | Pitch result | PA outcome |
|---|---|---|---|---|---|---|---|
| 1 | Mookie Betts | 0-0 | Four-seam | 98.2 | Called Strike | Single | |
| 1 | Mookie Betts | 0-1 | Four-seam | 96.8 | Ball | Single | |
| 1 | Mookie Betts | 1-1 | Four-seam | 96.6 | Called Strike | Single | |
| 1 | Mookie Betts | 1-2 | Four-seam | 99.1 | Ball | Single | |
| 1 | Mookie Betts | 2-2 | Slider | 82.6 | Foul | Single | |
| 1 | Mookie Betts | 2-2 | Slider | 79.0 | Ball | Single | |
| 1 | Mookie Betts | 3-2 | Slider | 79.9 | In play, no out | Single | |
| 1 | Freddie Freeman | 0-0 | Sinker | 95.7 | Foul | Strikeout | |
| 1 | Freddie Freeman | 0-1 | Slider | 79.1 | Swinging Strike | Strikeout | |
| 1 | Freddie Freeman | 0-2 | Slider | 80.8 | Ball | Strikeout | |
| 1 | Freddie Freeman | 1-2 | Slider | 80.0 | Swinging Strike (Blocked) | Strikeout | |
| 1 | Teoscar Hernández | 0-0 | Slider | 78.9 | Called Strike | Field Error | |
| 1 | Teoscar Hernández | 0-1 | Slider | 79.2 | Ball In Dirt | Field Error | |
| 1 | Teoscar Hernández | 1-1 | Changeup | 90.7 | Ball | Field Error | |
| 1 | Teoscar Hernández | 2-1 | Four-seam | 97.7 | In play, no out | Field Error | |
| 1 | Will Smith | 0-0 | Slider | 78.7 | Ball | Strikeout | |
| 1 | Will Smith | 1-0 | Four-seam | 97.4 | Called Strike | Strikeout | |
| 1 | Will Smith | 1-1 | Four-seam | 97.0 | Called Strike | Strikeout | |
| 1 | Will Smith | 1-2 | Four-seam | 97.8 | Swinging Strike | Strikeout | |
| 1 | Shohei Ohtani | 0-0 | Slider | 81.2 | Swinging Strike | Strikeout | |
| 1 | Shohei Ohtani | 0-1 | Slider | 80.0 | Ball | Strikeout | |
| 1 | Shohei Ohtani | 1-1 | Sinker | 98.9 | Called Strike | Strikeout | |
| 1 | Shohei Ohtani | 1-2 | Slider | 83.1 | Ball | Strikeout | |
| 1 | Shohei Ohtani | 2-2 | Slider | 82.9 | Swinging Strike | Strikeout | |
| 2 | Miguel Rojas | 0-0 | Slider | 75.6 | Ball | Strikeout | |
| 2 | Miguel Rojas | 1-0 | Four-seam | 95.2 | Ball | Strikeout | |
| 2 | Miguel Rojas | 2-0 | Four-seam | 93.7 | Foul | Strikeout | |
| 2 | Miguel Rojas | 2-1 | Four-seam | 96.4 | Foul | Strikeout | |
| 2 | Miguel Rojas | 2-2 | Slider | 79.3 | Foul | Strikeout | |
| 2 | Miguel Rojas | 2-2 | Slider | 80.3 | Swinging Strike | Strikeout | |
| 2 | Andy Pages | 0-0 | Slider | 79.0 | Ball | Strikeout | |
| 2 | Andy Pages | 1-0 | Changeup | 89.5 | Called Strike | Strikeout | |
| 2 | Andy Pages | 1-1 | Four-seam | 96.7 | Called Strike | Strikeout | |
| 2 | Andy Pages | 1-2 | Slider | 81.7 | Ball | Strikeout | |
| 2 | Andy Pages | 2-2 | Slider | 81.6 | Swinging Strike (Blocked) | Strikeout | |
| 2 | Kyle Tucker | 0-0 | Sinker | 97.0 | In play, no out | Single | |
| 2 | Enrique Hernández | 0-0 | Slider | 79.7 | Ball | Strikeout | |
| 2 | Enrique Hernández | 1-0 | Four-seam | 98.0 | Foul | Strikeout | |
| 2 | Enrique Hernández | 1-1 | Slider | 81.1 | Ball | Strikeout | |
| 2 | Enrique Hernández | 2-1 | Slider | 79.9 | Foul | Strikeout | |
| 2 | Enrique Hernández | 2-2 | Four-seam | 98.8 | Foul | Strikeout | |
| 2 | Enrique Hernández | 2-2 | Four-seam | 99.2 | Swinging Strike | Strikeout | |
| 3 | Mookie Betts | 0-0 | Four-seam | 95.5 | Called Strike | Single | |
| 3 | Mookie Betts | 0-1 | Changeup | 89.9 | Ball | Single | |
| 3 | Mookie Betts | 1-1 | Four-seam | 95.7 | Foul | Single | |
| 3 | Mookie Betts | 1-2 | Slider | 80.9 | Ball | Single | |
| 3 | Mookie Betts | 2-2 | Four-seam | 98.7 | In play, no out | Single | |
| 3 | Freddie Freeman | 0-0 | Slider | 80.5 | Foul | Flyout | |
| 3 | Freddie Freeman | 0-1 | Sinker | 95.4 | Ball | Flyout | |
| 3 | Freddie Freeman | 1-1 | Four-seam | 97.9 | Called Strike | Flyout | |
| 3 | Freddie Freeman | 1-2 | Four-seam | 98.8 | In play, out(s) | Flyout | |
| 3 | Teoscar Hernández | 0-0 | Four-seam | 97.4 | Called Strike | Flyout | |
| 3 | Teoscar Hernández | 0-1 | Slider | 82.1 | Ball | Flyout | |
| 3 | Teoscar Hernández | 1-1 | Changeup | 88.5 | Ball | Flyout | |
| 3 | Teoscar Hernández | 2-1 | Four-seam | 98.4 | In play, out(s) | Flyout | |
| 3 | Will Smith | 0-0 | Slider | 79.7 | Called Strike | Single | |
| 3 | Will Smith | 0-1 | Slider | 80.2 | Ball | Single | |
| 3 | Will Smith | 1-1 | Slider | 79.4 | In play, no out | Single | |
| 3 | Shohei Ohtani | 0-0 | Sinker | 98.2 | Called Strike | Catcher Interference | |
| 3 | Shohei Ohtani | 0-1 | Four-seam | 100.3 | Ball | Catcher Interference | |
| 3 | Shohei Ohtani | 1-1 | Sinker | 98.6 | Foul | Catcher Interference | |
| 3 | Miguel Rojas | 0-0 | Four-seam | 97.5 | In play, out(s) | Lineout | |
| 4 | Andy Pages | 0-0 | Four-seam | 95.7 | Ball | Single | |
| 4 | Andy Pages | 1-0 | Four-seam | 94.9 | In play, no out | Single | |
| 4 | Kyle Tucker | 0-0 | Slider | 78.9 | Foul | Lineout | |
| 4 | Kyle Tucker | 0-1 | Slider | 80.3 | Foul | Lineout | |
| 4 | Kyle Tucker | 0-2 | Four-seam | 98.7 | Ball | Lineout | |
| 4 | Kyle Tucker | 1-2 | Four-seam | 98.4 | In play, out(s) | Lineout | |
| 4 | Enrique Hernández | 0-0 | Changeup | 92.1 | Ball | Home Run | |
| 4 | Enrique Hernández | 1-0 | Changeup | 88.9 | In play, run(s) | Home Run | |
| 4 | Mookie Betts | 0-0 | Four-seam | 98.2 | Ball | Groundout | |
| 4 | Mookie Betts | 1-0 | Slider | 80.3 | Called Strike | Groundout | |
| 4 | Mookie Betts | 1-1 | Four-seam | 97.8 | Foul | Groundout | |
| 4 | Mookie Betts | 1-2 | Slider | 83.4 | Foul | Groundout | |
| 4 | Mookie Betts | 1-2 | Four-seam | 97.2 | Ball | Groundout | |
| 4 | Mookie Betts | 2-2 | Four-seam | 97.1 | In play, out(s) | Groundout | |
| 4 | Freddie Freeman | 0-0 | Sinker | 97.7 | Swinging Strike | Home Run | |
| 4 | Freddie Freeman | 0-1 | Sinker | 95.7 | In play, run(s) | Home Run | |
| 4 | Teoscar Hernández | 0-0 | Slider | 79.7 | Called Strike | Flyout | |
| 4 | Teoscar Hernández | 0-1 | Slider | 80.2 | In play, out(s) | Flyout | |
| 5 | Will Smith | 0-0 | Four-seam | 96.4 | Called Strike | Strikeout | |
| 5 | Will Smith | 0-1 | Four-seam | 95.9 | Ball | Strikeout | |
| 5 | Will Smith | 1-1 | Four-seam | 95.9 | Foul | Strikeout | |
| 5 | Will Smith | 1-2 | Four-seam | 97.9 | Foul | Strikeout | |
| 5 | Will Smith | 1-2 | Slider | 82.2 | Swinging Strike | Strikeout | |
| 5 | Shohei Ohtani | 0-0 | Slider | 79.8 | Ball | Flyout | |
| 5 | Shohei Ohtani | 1-0 | Slider | 78.5 | Ball | Flyout | |
| 5 | Shohei Ohtani | 2-0 | Four-seam | 95.5 | Ball | Flyout | |
| 5 | Shohei Ohtani | 3-0 | Four-seam | 95.0 | Called Strike | Flyout | |
| 5 | Shohei Ohtani | 3-1 | Four-seam | 97.8 | In play, out(s) | Flyout | |
| 5 | Miguel Rojas | 0-0 | Slider | 78.5 | Called Strike | Groundout | |
| 5 | Miguel Rojas | 0-1 | Four-seam | 96.3 | Foul | Groundout | |
| 5 | Miguel Rojas | 0-2 | Slider | 82.9 | Ball | Groundout | |
| 5 | Miguel Rojas | 1-2 | Slider | 78.2 | Ball | Groundout | |
| 5 | Miguel Rojas | 2-2 | Four-seam | 97.1 | In play, out(s) | Groundout |
Sources, definitions and limitations
The official MLB final record supplies the score, pitching line, event order and final calls. Baseball Savant’s complete gamefeed supplies pitch measurements. Statcast Search supplies the regular-season comparison. Reporting cutoff: October 6, 2026, 11:48 PM Mountain Time. Game 3 was final.
All 95 physical pitches reconcile by unique ID, order, type, final call and count before the pitch. The same audit reconciles 24 batters faced, 15 integer outs and 7 strikeouts. Automatic calls and non-pitch actions are excluded from physical-pitch totals. A catcher-interference plate appearance remains separate from the final physical pitch’s result.
Baseline: 2,574 physical pitches in 27 regular-season starts, 2026-03-27 through 2026-09-23. Both game IDs and total pitches match the official game log. Postseason appearances are excluded. All classifications remain in pitch-share denominators.
Whiff rate means recorded misses divided by swings. Swinging strikes, blocked swinging strikes and foul tips count as misses, matching Savant’s supplied summary. Fouls, balls in play and any bunt attempts also count as swings. Rates retain their numerators and denominators. Hard-hit means recorded exit speed of at least 95 mph; the baseline denominator includes only balls with a recorded exit speed.
The at-bat chart uses catcher-view coordinates in feet, a 17-inch plate width and the batter’s recorded vertical boundaries. Numbered markers retain their exact coordinates and are not ball size. Overlaps are resolved through the adjacent sequence list rather than moving the points. The supplied zone flag, measured ball-center location and official ball/strike call are distinct fields. Statcast’s field documentation identifies middle-of-plate locations and ABS-defined zone boundaries for 2026.
Release speed is mph, spin is rpm, extension is feet and induced vertical break is inches relative to a gravity-only path. All outing pitches have these measurements and plate locations. All 16 balls in play have recorded exit speed and launch angle. Missing contact values for other pitches remain blank. Per-ball expected batting averages are source estimates, not actual results or an official aggregate.
This is descriptive analysis of one completed outing. Locations and speed cannot establish intended targets, hitter expectations, fatigue or injury. The image captions identify the source event.