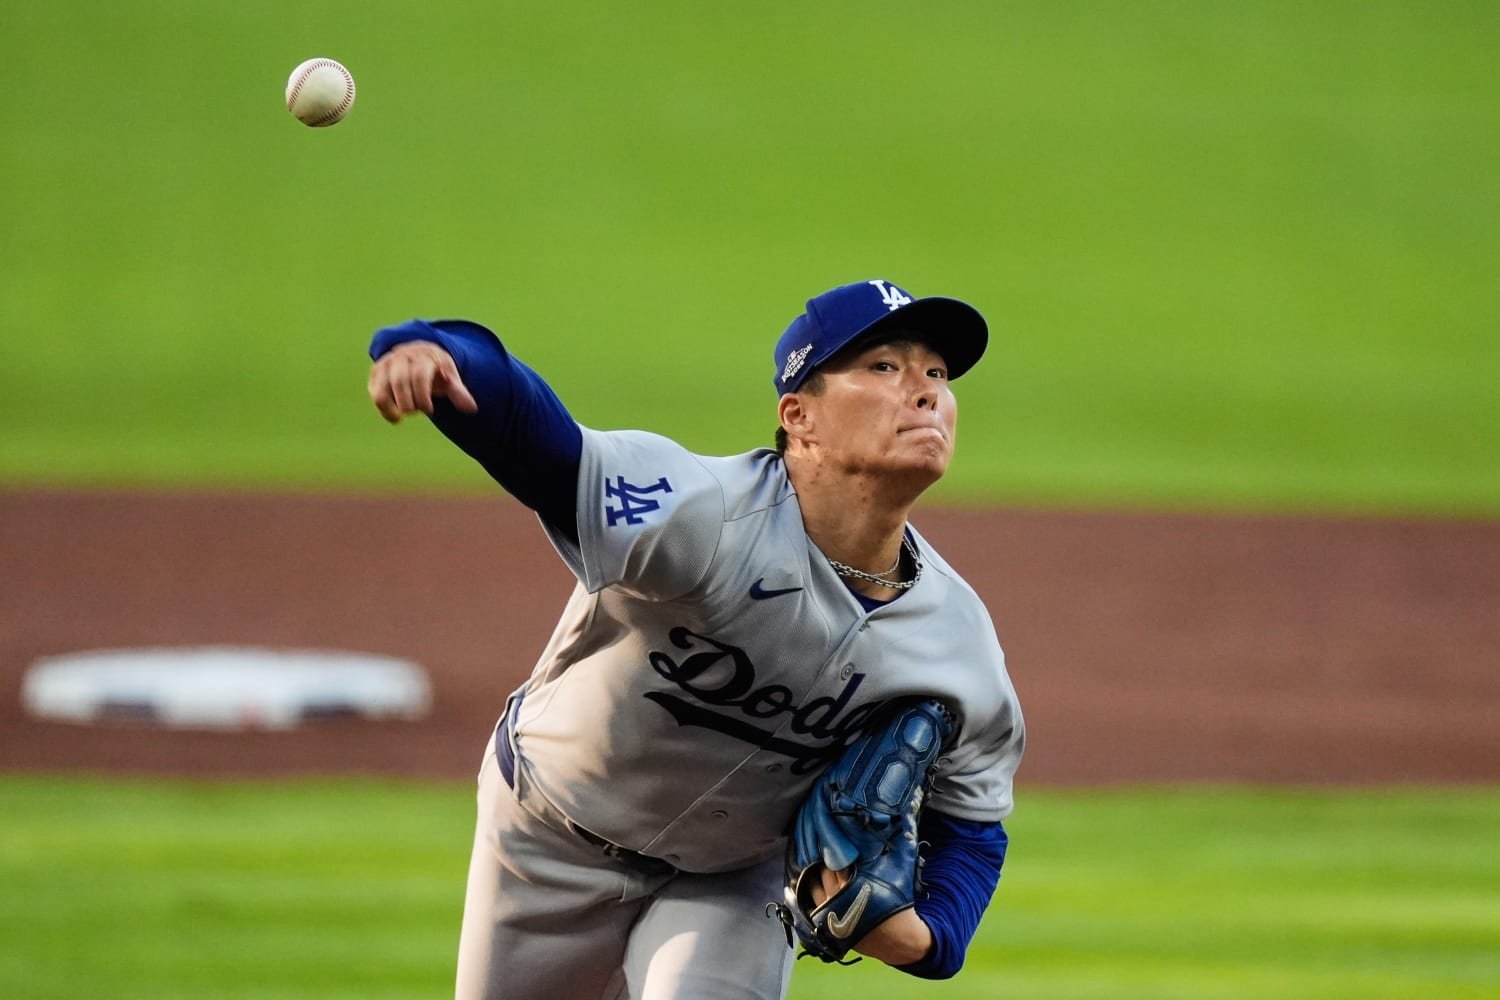
Ronald Acuña Jr. had already missed a cutter and a splitter when Yoshinobu Yamamoto changed the confrontation in the first inning. With the count 2–2, Yamamoto threw his first four-seam fastball of the at-bat, 97.1 mph, and Acuña took it for strike three. Acuña challenged the call. The official record retained the strikeout.
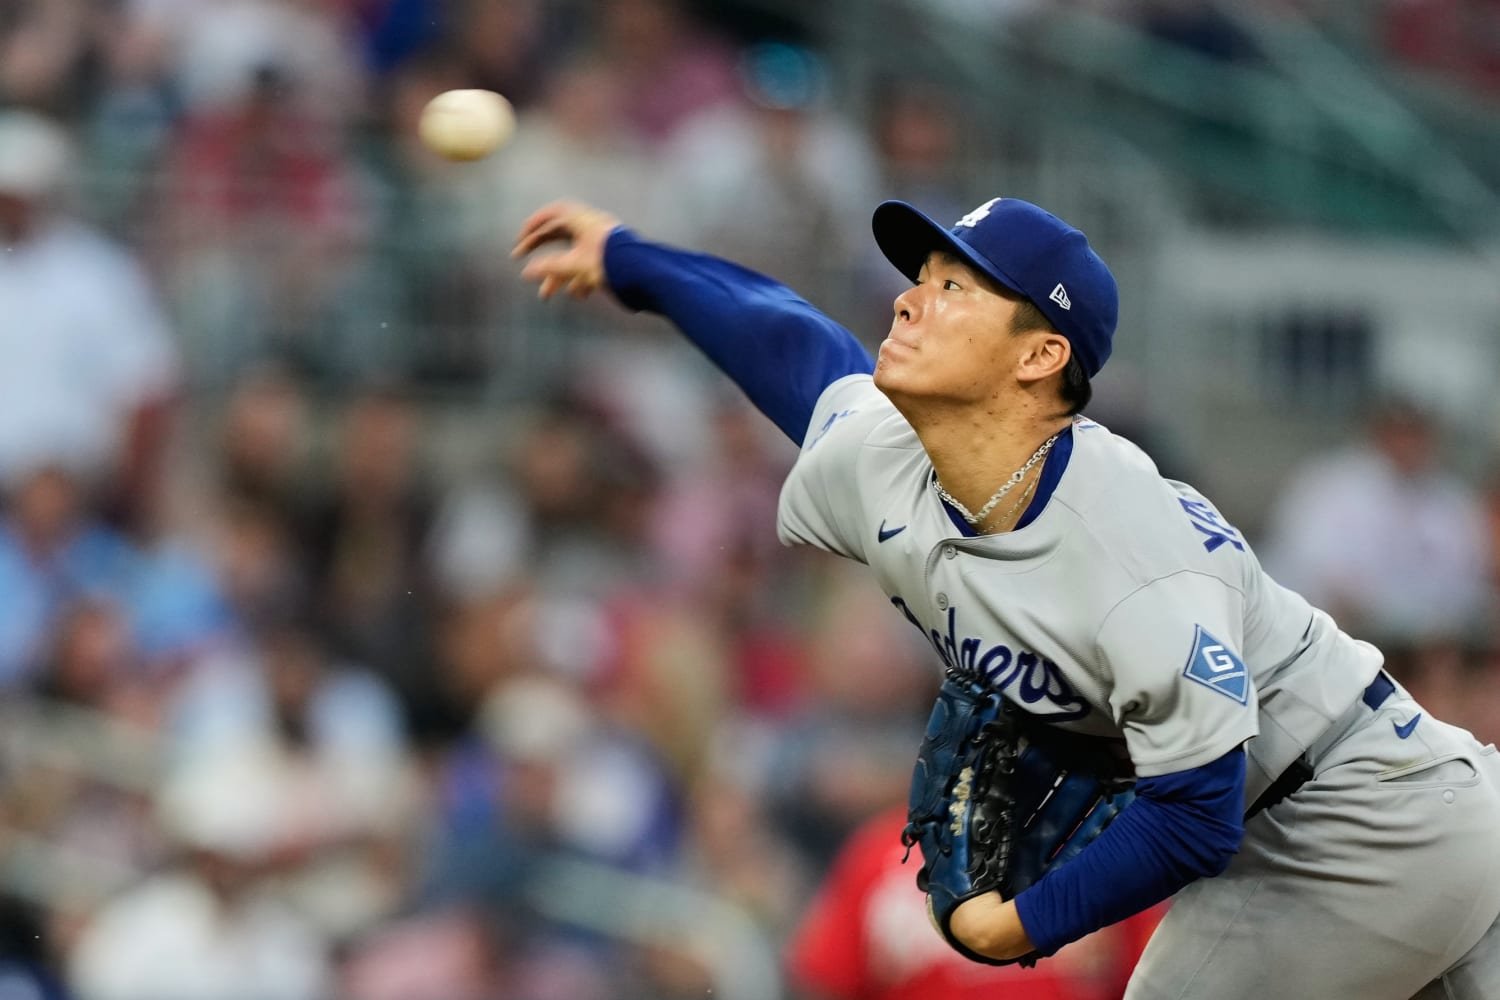
That five-pitch sequence contained a useful distinction in Yamamoto’s 10-strikeout start: his secondary pitches created misses, but the fastball could finish a hitter without a swing. He held Atlanta to one run on four hits and one walk over seven innings at Truist Park on October 6. The Dodgers won NLDS Game 3, 3–1, and moved ahead 2–1 in the series.
The complete 98-pitch record shows a bigger four-seam share than Yamamoto used during the regular season, alongside productive splitter and curveball work. It also shows a fifth inning in which he lost favorable counts and needed contact outs to protect the lead. The explanation requires both parts of the outing.
More four-seamers, fewer sinkers
Yamamoto threw 33 four-seamers, 33.7% of his pitches, compared with 26.2% in the regular season. His sinker fell from 13.1% to 6.1%, just six pitches. The splitter remained a major part of the repertoire at 28.6%, while 15 curves, 12 cutters and four sliders completed the mix.
The baseline covers all 2,734 physical pitches in 28 regular-season starts, March 26 through September 23. It excludes this postseason outing and matches the official season pitch total. Yamamoto’s four-seamer averaged 96.6 mph in Game 3, compared with 96.1 during the season. This was a change in selection with a modest increase in speed, rather than an entirely new repertoire.
The batting-side comparison supports the selection finding. Against right-handed hitters, the four-seamer rose from 21.8% to 31.5%, while the sinker fell from 21.4% to 7.4%. The four-seamer also increased against left-handers, from 29.7% to 36.4%. Atlanta’s handedness mix affected the opportunities, but it does not account for the whole shift. These are descriptive samples of 54 pitches to right-handers and 44 to left-handers, not proof of Yamamoto’s intended plan.
Pitch selection: regular season and Game 3
Share of all physical pitches. Scale: 0-40%.
Four-seam
Splitter
Curve
Cutter
Sinker
Slider
The fastball’s value included the pitches Atlanta took
The four-seamer supplied eight of Yamamoto’s 16 called strikes and finished four strikeouts. It produced only one swinging strike and one foul tip, which Baseball Savant includes in its miss total. Seven four-seamers went into play, and all seven became outs. Its contribution cannot be assessed from missed bats alone.
Acuña’s opening strikeout illustrates the division of work. Yamamoto started with a splitter for a ball, earned a miss on a 94.9 mph cutter, missed the zone with another cutter and drew a second miss on a 92.8 mph splitter. The 97.1 mph four-seamer then ended the at-bat on a take. The four earlier pitches were below Acuña’s recorded zone; the final pitch was much higher. The locations describe the sequence without establishing what Acuña expected.
Yamamoto found another fastball finish against Matt Olson in the sixth. After a curveball miss and three consecutive balls, he used a 96.5 mph four-seamer for a foul and a 96.4 mph four-seamer for called strike three. The tracking feed classifies that last pitch outside its supplied zone. The ledger preserves both the measured location and the official call, rather than treating them as interchangeable.
Ronald Acuña Jr.: inning 1
The splitter and curve supplied different ways to miss
The splitter generated six misses in 10 swings and finished four strikeouts. Yamamoto used it on 12 of his 26 pitches thrown with two strikes. Ozzie Albies, Lane Thomas and Austin Riley each struck out on it during the first three innings, and Riley missed another splitter for the final out of Yamamoto’s seventh.
The curve generated five misses in nine swings, with no ball put into play. It finished both of Drake Baldwin’s strikeouts. In the first, Yamamoto fell behind 3–1, landed a 97.2 mph fastball for a take and then got Baldwin to miss a 78.7 mph curve below the recorded zone. Baldwin missed a 78.0 mph curve on another full count in the third.
The two secondary pitches offered substantially different speeds and movement. The splitter averaged 92.0 mph and about 0.5 inches of induced vertical break, while the curve averaged 77.7 mph and about 17 inches of movement downward relative to a gravity-only path. Induced break measures movement against that reference; it does not mean a fastball physically rises or prove that different pitches looked identical early in flight.
Across the outing, Yamamoto recorded 17 misses in 46 swings, a 37.0% whiff rate under Savant’s foul-tip convention. His regular-season sample was 378 misses in 1,355 swings, 27.9%. The splitter and curve supplied 11 of those 17 Game 3 misses, although 19 combined swings are too few to establish a lasting improvement.
The fifth inning tested the explanation
Atlanta opened the fifth with singles by Mauricio Dubón and Thomas. Riley popped out, but Rowdy Tellez then walked on four pitches to load the bases. Yamamoto threw 10 balls among his 18 pitches that inning and generated only one miss. The strikeout pattern from the early innings was no longer carrying him through the traffic.
Baldwin grounded out on a first-pitch splitter, scoring Dubón. With two runners still aboard, Yamamoto fell behind Acuña 3–1 before another splitter produced a groundout to second. Those two balls left the bat at 82.7 and 70.6 mph. They explain how Atlanta’s threat ended, but the walk and unfavorable counts belong in the account as well.
The Braves put 15 balls in play against Yamamoto. Two reached Statcast’s 95 mph hard-hit threshold: Olson’s 109.5 mph single and Harris’s 105.5 mph groundout in the fourth. The overall exit-speed average was 81.8 mph, including Harris’s 34.2 mph bunt single. Removing that bunt raises the average to 85.2 mph across 14 balls, so the low contact speed was not solely a bunt effect. The single-game sample still includes defense and the particular hitters Atlanta sent up.
Lower late velocity, followed by six straight outs
Yamamoto’s four-seamer averaged 97.3 mph on six pitches in the first inning and 95.2 on five in the seventh. The later decline is visible in the tracking record, but those small samples cannot diagnose fatigue or injury. His final two innings took 23 pitches and contained no baserunner.
After the fifth-inning escape, Olson struck out looking, Albies flew out and Harris grounded out. In the seventh, Dubón popped out, Thomas struck out on a caught foul tip and Riley missed a 90.8 mph splitter. Yamamoto finished at 98 pitches with the bases empty, leaving no inherited runner for the bullpen to resolve.
A later outing can test whether the larger four-seam share persists against a different lineup. Game 3 establishes the narrower finding: the fastball acquired strikes through takes and contact outs, while the splitter and curve supplied most of the misses. That combination survived a difficult fifth without requiring the same method of getting outs in every inning.
Workload and four-seam speed by inning
| Inning | Pitches | Cumulative | Four-seam mph | Four-seam n | Outs recorded |
|---|---|---|---|---|---|
| 1 | 15 | 15 | 97.3 | 6 | 3 |
| 2 | 17 | 32 | 97.4 | 2 | 3 |
| 3 | 12 | 44 | 96.9 | 4 | 3 |
| 4 | 13 | 57 | 97.1 | 3 | 3 |
| 5 | 18 | 75 | 96.8 | 7 | 3 |
| 6 | 12 | 87 | 96.1 | 6 | 3 |
| 7 | 11 | 98 | 95.2 | 5 | 3 |
All 98 pitches
Filter the complete outing and select any pitch for its measurements. Pitch result and completed plate-appearance outcome are separate columns.
98 of 98 pitches
No pitches match these filters.
| Pitch | Inning | Hitter | Count before | Type | mph | Pitch result | PA outcome |
|---|---|---|---|---|---|---|---|
| 1 | Drake Baldwin | 0-0 | Curve | 79.5 | Swinging Strike | Strikeout | |
| 1 | Drake Baldwin | 0-1 | Four-seam | 97.1 | Ball | Strikeout | |
| 1 | Drake Baldwin | 1-1 | Cutter | 92.8 | Ball | Strikeout | |
| 1 | Drake Baldwin | 2-1 | Four-seam | 97.9 | Ball | Strikeout | |
| 1 | Drake Baldwin | 3-1 | Four-seam | 97.2 | Called Strike | Strikeout | |
| 1 | Drake Baldwin | 3-2 | Curve | 78.7 | Swinging Strike | Strikeout | |
| 1 | Ronald Acuña Jr. | 0-0 | Splitter | 93.9 | Ball | Strikeout | |
| 1 | Ronald Acuña Jr. | 1-0 | Cutter | 94.9 | Swinging Strike | Strikeout | |
| 1 | Ronald Acuña Jr. | 1-1 | Cutter | 92.0 | Ball | Strikeout | |
| 1 | Ronald Acuña Jr. | 2-1 | Splitter | 92.8 | Swinging Strike | Strikeout | |
| 1 | Ronald Acuña Jr. | 2-2 | Four-seam | 97.1 | Called Strike | Strikeout | |
| 1 | Matt Olson | 0-0 | Four-seam | 97.5 | Called Strike | Groundout | |
| 1 | Matt Olson | 0-1 | Curve | 78.4 | Called Strike | Groundout | |
| 1 | Matt Olson | 0-2 | Splitter | 94.0 | Ball | Groundout | |
| 1 | Matt Olson | 1-2 | Four-seam | 97.1 | In play, out(s) | Groundout | |
| 2 | Ozzie Albies | 0-0 | Curve | 77.7 | Called Strike | Strikeout | |
| 2 | Ozzie Albies | 0-1 | Slider | 88.0 | Ball | Strikeout | |
| 2 | Ozzie Albies | 1-1 | Sinker | 96.1 | Swinging Strike | Strikeout | |
| 2 | Ozzie Albies | 1-2 | Splitter | 92.6 | Swinging Strike (Blocked) | Strikeout | |
| 2 | Michael Harris II | 0-0 | Curve | 77.3 | Ball | Single | |
| 2 | Michael Harris II | 1-0 | Curve | 76.1 | Called Strike | Single | |
| 2 | Michael Harris II | 1-1 | Cutter | 93.1 | In play, no out | Single | |
| 2 | Mauricio Dubón | 0-0 | Four-seam | 97.5 | Called Strike | Flyout | |
| 2 | Mauricio Dubón | 0-1 | Cutter | 93.5 | Foul | Flyout | |
| 2 | Mauricio Dubón | 0-2 | Splitter | 92.9 | Ball | Flyout | |
| 2 | Mauricio Dubón | 1-2 | Sinker | 96.6 | Ball | Flyout | |
| 2 | Mauricio Dubón | 2-2 | Splitter | 92.0 | In play, out(s) | Flyout | |
| 2 | Lane Thomas | 0-0 | Curve | 78.7 | Ball | Strikeout | |
| 2 | Lane Thomas | 1-0 | Four-seam | 97.3 | Called Strike | Strikeout | |
| 2 | Lane Thomas | 1-1 | Sinker | 95.4 | Foul | Strikeout | |
| 2 | Lane Thomas | 1-2 | Splitter | 92.6 | Ball In Dirt | Strikeout | |
| 2 | Lane Thomas | 2-2 | Splitter | 92.6 | Swinging Strike | Strikeout | |
| 3 | Austin Riley | 0-0 | Four-seam | 97.4 | Ball | Strikeout | |
| 3 | Austin Riley | 1-0 | Four-seam | 97.2 | Called Strike | Strikeout | |
| 3 | Austin Riley | 1-1 | Sinker | 95.8 | Ball | Strikeout | |
| 3 | Austin Riley | 2-1 | Curve | 78.4 | Foul | Strikeout | |
| 3 | Austin Riley | 2-2 | Splitter | 92.7 | Swinging Strike | Strikeout | |
| 3 | Ha-Seong Kim | 0-0 | Four-seam | 96.1 | In play, out(s) | Flyout | |
| 3 | Drake Baldwin | 0-0 | Sinker | 97.1 | Called Strike | Strikeout | |
| 3 | Drake Baldwin | 0-1 | Splitter | 92.1 | Ball | Strikeout | |
| 3 | Drake Baldwin | 1-1 | Four-seam | 97.0 | Foul | Strikeout | |
| 3 | Drake Baldwin | 1-2 | Splitter | 93.8 | Ball | Strikeout | |
| 3 | Drake Baldwin | 2-2 | Cutter | 93.9 | Ball | Strikeout | |
| 3 | Drake Baldwin | 3-2 | Curve | 78.0 | Swinging Strike | Strikeout | |
| 4 | Ronald Acuña Jr. | 0-0 | Cutter | 91.4 | In play, out(s) | Groundout | |
| 4 | Matt Olson | 0-0 | Sinker | 95.1 | Called Strike | Single | |
| 4 | Matt Olson | 0-1 | Cutter | 92.0 | In play, no out | Single | |
| 4 | Ozzie Albies | 0-0 | Splitter | 90.7 | Called Strike | Strikeout | |
| 4 | Ozzie Albies | 0-1 | Slider | 86.6 | Foul | Strikeout | |
| 4 | Ozzie Albies | 0-2 | Slider | 86.4 | Foul | Strikeout | |
| 4 | Ozzie Albies | 0-2 | Four-seam | 96.9 | Swinging Strike | Strikeout | |
| 4 | Michael Harris II | 0-0 | Splitter | 90.9 | Swinging Strike | Groundout | |
| 4 | Michael Harris II | 0-1 | Four-seam | 96.8 | Ball | Groundout | |
| 4 | Michael Harris II | 1-1 | Splitter | 91.7 | Ball In Dirt | Groundout | |
| 4 | Michael Harris II | 2-1 | Curve | 78.1 | Foul | Groundout | |
| 4 | Michael Harris II | 2-2 | Splitter | 92.0 | Ball | Groundout | |
| 4 | Michael Harris II | 3-2 | Four-seam | 97.7 | In play, out(s) | Groundout | |
| 5 | Mauricio Dubón | 0-0 | Cutter | 91.8 | Swinging Strike | Single | |
| 5 | Mauricio Dubón | 0-1 | Splitter | 92.3 | Ball | Single | |
| 5 | Mauricio Dubón | 1-1 | Four-seam | 96.3 | Ball | Single | |
| 5 | Mauricio Dubón | 2-1 | Four-seam | 97.0 | Called Strike | Single | |
| 5 | Mauricio Dubón | 2-2 | Splitter | 91.9 | In play, no out | Single | |
| 5 | Lane Thomas | 0-0 | Cutter | 91.3 | In play, no out | Single | |
| 5 | Austin Riley | 0-0 | Splitter | 91.6 | Ball | Pop Out | |
| 5 | Austin Riley | 1-0 | Four-seam | 97.4 | In play, out(s) | Pop Out | |
| 5 | Rowdy Tellez | 0-0 | Splitter | 90.4 | Ball | Walk | |
| 5 | Rowdy Tellez | 1-0 | Splitter | 91.8 | Ball | Walk | |
| 5 | Rowdy Tellez | 2-0 | Four-seam | 96.8 | Ball | Walk | |
| 5 | Rowdy Tellez | 3-0 | Four-seam | 97.1 | Ball | Walk | |
| 5 | Drake Baldwin | 0-0 | Splitter | 92.1 | In play, run(s) | Groundout | |
| 5 | Ronald Acuña Jr. | 0-0 | Splitter | 91.3 | Ball | Groundout | |
| 5 | Ronald Acuña Jr. | 1-0 | Cutter | 92.1 | Called Strike | Groundout | |
| 5 | Ronald Acuña Jr. | 1-1 | Four-seam | 96.2 | Ball | Groundout | |
| 5 | Ronald Acuña Jr. | 2-1 | Four-seam | 97.0 | Ball | Groundout | |
| 5 | Ronald Acuña Jr. | 3-1 | Splitter | 91.7 | In play, out(s) | Groundout | |
| 6 | Matt Olson | 0-0 | Curve | 78.2 | Swinging Strike | Strikeout | |
| 6 | Matt Olson | 0-1 | Splitter | 91.8 | Ball | Strikeout | |
| 6 | Matt Olson | 1-1 | Splitter | 91.7 | Ball | Strikeout | |
| 6 | Matt Olson | 2-1 | Four-seam | 95.7 | Ball | Strikeout | |
| 6 | Matt Olson | 3-1 | Four-seam | 96.5 | Foul | Strikeout | |
| 6 | Matt Olson | 3-2 | Four-seam | 96.4 | Called Strike | Strikeout | |
| 6 | Ozzie Albies | 0-0 | Curve | 75.8 | Ball | Flyout | |
| 6 | Ozzie Albies | 1-0 | Four-seam | 96.1 | In play, out(s) | Flyout | |
| 6 | Michael Harris II | 0-0 | Cutter | 93.9 | Foul | Groundout | |
| 6 | Michael Harris II | 0-1 | Four-seam | 96.0 | Ball | Groundout | |
| 6 | Michael Harris II | 1-1 | Curve | 76.4 | Swinging Strike | Groundout | |
| 6 | Michael Harris II | 1-2 | Four-seam | 96.1 | In play, out(s) | Groundout | |
| 7 | Mauricio Dubón | 0-0 | Curve | 76.7 | Foul | Pop Out | |
| 7 | Mauricio Dubón | 0-1 | Curve | 77.0 | Foul | Pop Out | |
| 7 | Mauricio Dubón | 0-2 | Four-seam | 94.7 | In play, out(s) | Pop Out | |
| 7 | Lane Thomas | 0-0 | Four-seam | 96.0 | Foul | Strikeout | |
| 7 | Lane Thomas | 0-1 | Splitter | 90.5 | Called Strike | Strikeout | |
| 7 | Lane Thomas | 0-2 | Four-seam | 95.2 | Foul | Strikeout | |
| 7 | Lane Thomas | 0-2 | Four-seam | 95.3 | Foul Tip | Strikeout | |
| 7 | Austin Riley | 0-0 | Slider | 87.1 | Swinging Strike | Strikeout | |
| 7 | Austin Riley | 0-1 | Four-seam | 94.6 | Foul | Strikeout | |
| 7 | Austin Riley | 0-2 | Splitter | 91.7 | Ball | Strikeout | |
| 7 | Austin Riley | 1-2 | Splitter | 90.8 | Swinging Strike | Strikeout |
Sources, definitions and limitations
The official MLB final record supplies the score, pitching line, event order and final calls. Baseball Savant’s complete gamefeed supplies pitch measurements. Statcast Search supplies the regular-season comparison. Reporting cutoff: October 6, 2026, 11:48 PM Mountain Time. Game 3 was final.
All 98 physical pitches reconcile by unique ID, order, type, final call and count before the pitch. The same audit reconciles 26 batters faced, 21 integer outs and 10 strikeouts. Automatic calls and non-pitch actions are excluded from physical-pitch totals. A catcher-interference plate appearance remains separate from the final physical pitch’s result.
Baseline: 2,734 physical pitches in 28 regular-season starts, 2026-03-26 through 2026-09-23. Both game IDs and total pitches match the official game log. Postseason appearances are excluded. All classifications remain in pitch-share denominators. The regular-season sample has 1 pitch without measured release speed; that pitch stays in selection denominators and is excluded only from velocity averages.
Whiff rate means recorded misses divided by swings. Swinging strikes, blocked swinging strikes and foul tips count as misses, matching Savant’s supplied summary. Fouls, balls in play and any bunt attempts also count as swings. Rates retain their numerators and denominators. Hard-hit means recorded exit speed of at least 95 mph; the baseline denominator includes only balls with a recorded exit speed.
The at-bat chart uses catcher-view coordinates in feet, a 17-inch plate width and the batter’s recorded vertical boundaries. Numbered markers retain their exact coordinates and are not ball size. Overlaps are resolved through the adjacent sequence list rather than moving the points. The supplied zone flag, measured ball-center location and official ball/strike call are distinct fields. Statcast’s field documentation identifies middle-of-plate locations and ABS-defined zone boundaries for 2026.
Release speed is mph, spin is rpm, extension is feet and induced vertical break is inches relative to a gravity-only path. All outing pitches have these measurements and plate locations. All 15 balls in play have recorded exit speed and launch angle. Missing contact values for other pitches remain blank. Per-ball expected batting averages are source estimates, not actual results or an official aggregate.
This is descriptive analysis of one completed outing. Locations and speed cannot establish intended targets, hitter expectations, fatigue or injury. The image captions identify the source event.