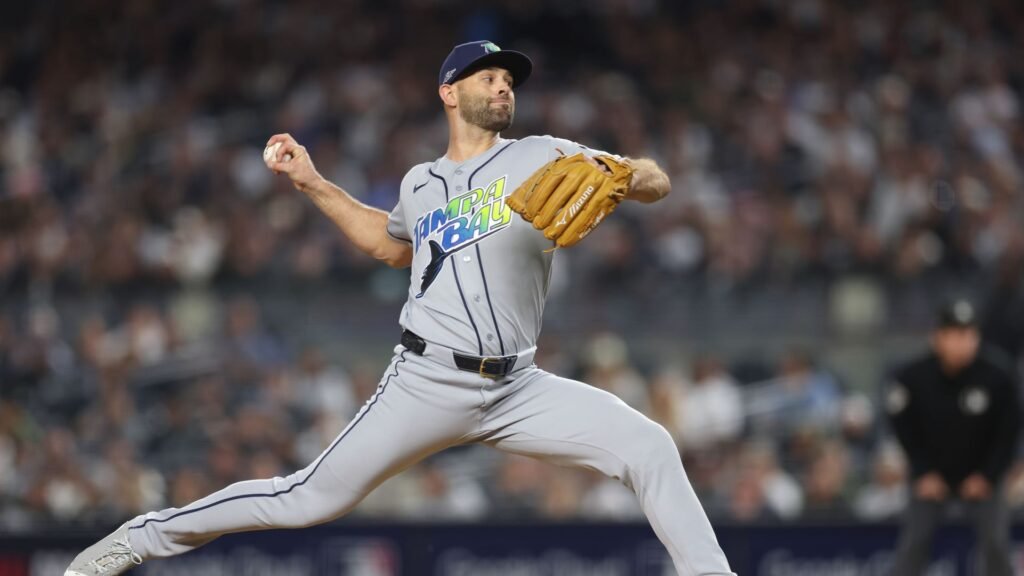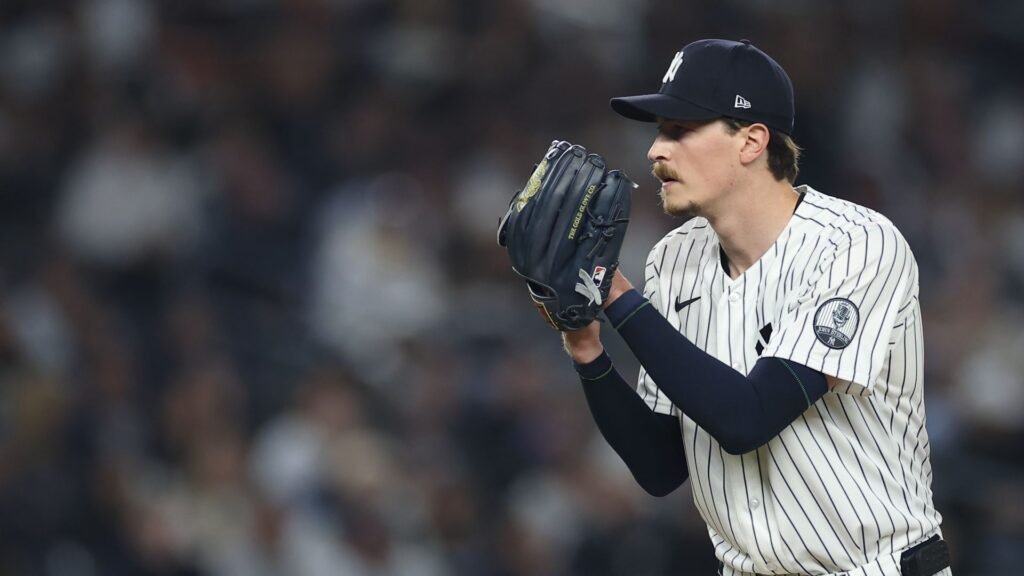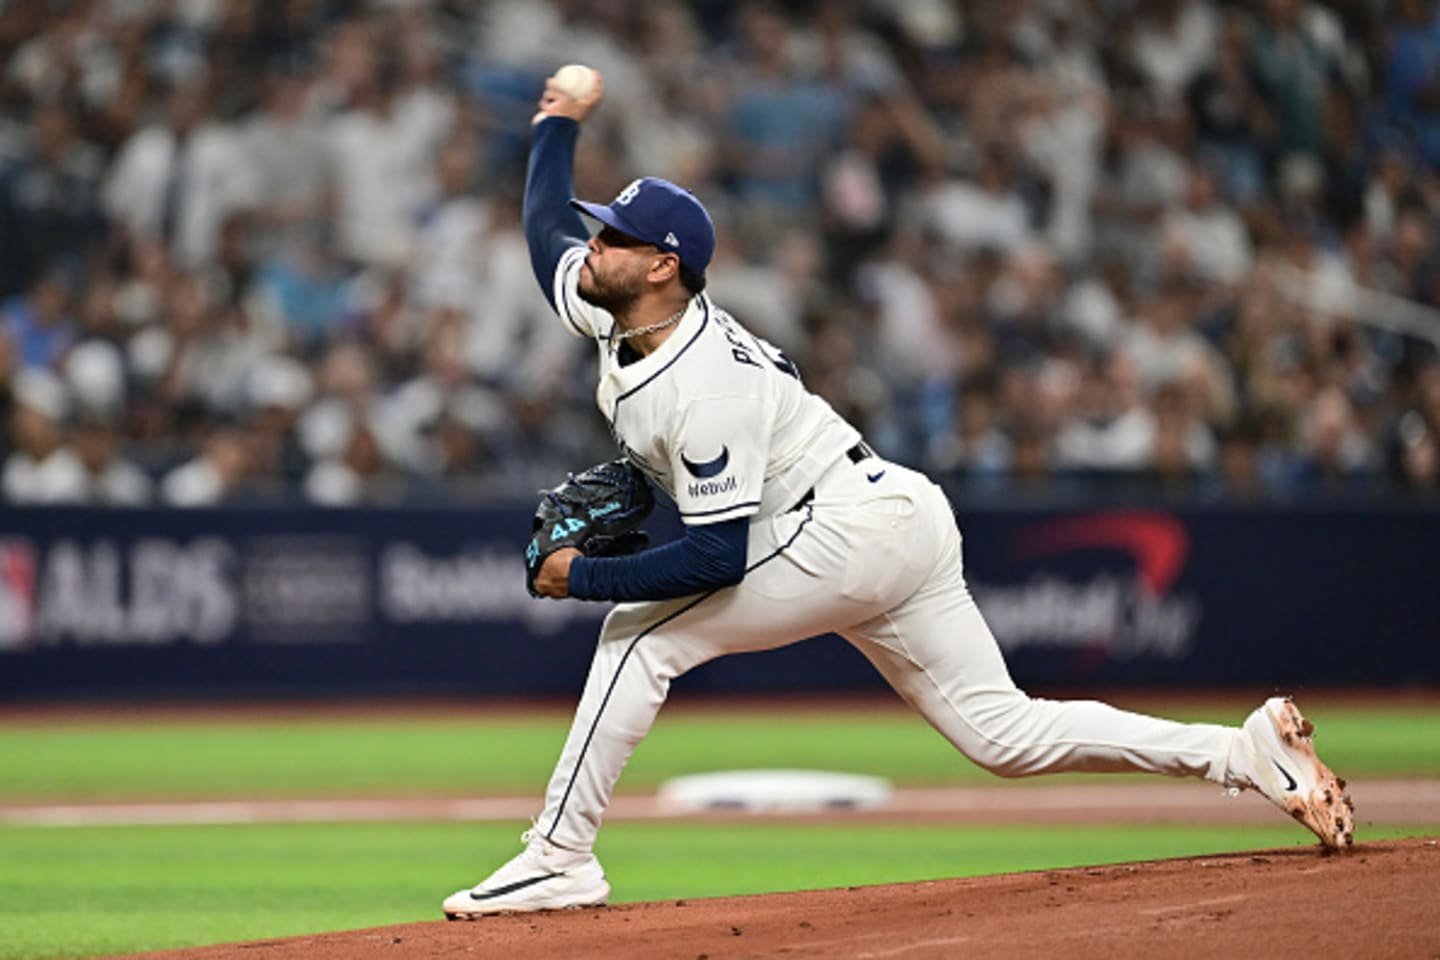
Jazz Chisholm Jr. had seen eight pitches, fouling off both fastballs and a changeup, when Freddy Peralta introduced a curveball. The 82.6 mph pitch arrived on a full count and produced a swinging strikeout. It was Peralta's first curve of the night, after a confrontation built almost entirely around his faster offerings.
That at-bat was an exception within a concentrated repertoire. Peralta used 43 four-seam fastballs and 20 changeups in his 66-pitch ALDS Game 2 start against the Yankees on October 5. Only three pitches were curves. He retired the first nine batters, then finished with one run allowed on three hits over 4 2/3 innings, with one walk and three strikeouts.
Tampa Bay won 5-2, but Peralta departed with the score tied 1-1 and two Yankees on base. The complete record supports a useful distinction: a harder, frequently used fastball helped him get through most of two trips through the lineup; relief pitching preserved the line after his final confrontation.
More fastballs, with a fair Tampa Bay comparison
The four-seamer averaged 96.8 mph and accounted for 65.2% of his pitches. His full regular-season baseline was 94.3 mph and 53.0% usage across 2,959 physical pitches in 32 games, March 26 through September 25.
That full-season sample spans the Mets and Rays, so Tampa Bay's portion is the more immediate check. In 866 regular-season pitches over 10 Rays appearances, August 4 through September 25, his fastball averaged 94.8 mph and represented 52.1% of the repertoire. Game 2 was faster and more fastball-heavy against that comparison too.
The changeup's 30.3% share was close to its 29.7% Tampa Bay baseline, although above the 23.4% full-season rate. This was principally a shift toward the four-seamer and away from other breaking pitches, rather than evidence that the changeup suddenly became a new weapon.
Pitch selection: regular season and Game 2
Share of all physical pitches. Scale: 0-70%.
Four-seam
Changeup
Curve
Sweeper
Slider
Slow curve
The matchup helped shape the pitch mix
Left-handed batters accounted for 61 of the 66 pitches. All 20 changeups and all three curves went to that group. Peralta threw only five pitches to right-handed George Lombard Jr., all fastballs. The whole-outing percentages therefore reflect a heavily left-handed lineup.
Even within the left-handed matchups, fastball use increased: 62.3% in Game 2 against 51.4% over the full regular season. That supports the selection finding, while the small right-handed sample cannot establish a general approach against righties.
Peralta generated eight misses in 26 four-seam swings and three in 10 changeup swings. His three strikeouts ended on three different pitches: an 89.6 mph changeup to Luis García Jr., the curve to Chisholm and a 97.3 mph fastball to Austin Wells. The setup pitches contributed to those finishes; the final pitch alone does not explain them.
Jazz Chisholm Jr.: inning 2
Rice showed the limit of the combination
Ben Rice opened the fourth by taking a fastball for strike one, watching two changeups miss and swinging through another. Peralta returned to the changeup at 2-2. Rice hit that 89.8 mph pitch at 100.1 mph for a tying home run to right field.
The changeup thus produced both an opening-inning strikeout and the only run charged to Peralta. Cody Bellinger followed Rice with a single on another changeup. Peralta recovered with a popup, a forceout and another popup, completing the inning without further scoring.
His 14 balls in play included six hit at least 95 mph. Some forceful contact became outs, including Spencer Jones' 106.4 mph fly ball in the second and Lombard's 100.8 mph groundout. Peralta's result depended partly on contact shape and the Rays converting playable balls, alongside 12 misses in 37 swings.
A short finish, without a velocity collapse
With two outs in the fifth, Wells doubled off a 95.7 mph fastball. Ryan McMahon then recovered from 0-2 to walk, taking a 98.0 mph fastball for ball four on Peralta's 66th pitch. Cam Booser entered, walked Rice to load the bases and induced Bellinger's inning-ending flyout. Neither of Peralta's inherited runners scored.
Peralta's fifth-inning fastballs still averaged 96.9 mph across 13 pitches. The available record does not show that lost velocity forced the change. It shows a two-out double, a walk and a bullpen decision before the lineup turned over again.
The next comparison should ask whether this fastball speed and heavier usage persist against a different batting order. The changeup's Tampa Bay usage was already established. Game 2's clearer departure was how hard and how often Peralta threw the four-seamer, with an important save of his pitching line supplied by Booser.
Workload and four-seam speed by inning
| Inning | Pitches | Cumulative | Four-seam mph | Four-seam n | Outs recorded |
|---|---|---|---|---|---|
| 1 | 8 | 8 | 97.0 | 6 | 3 |
| 2 | 14 | 22 | 96.4 | 9 | 3 |
| 3 | 14 | 36 | 97.1 | 8 | 3 |
| 4 | 14 | 50 | 96.4 | 7 | 3 |
| 5* | 16 | 66 | 96.9 | 13 | 2 |
All 66 pitches
Filter the complete outing and select any pitch for its measurements. Pitch result and completed plate-appearance outcome are separate columns.
66 of 66 pitches
No pitches match these filters.
| Pitch | Inning | Hitter | Count before | Tracking type | mph | Pitch result | PA outcome |
|---|---|---|---|---|---|---|---|
| 1 | Ben Rice | 0-0 | Four-seam | 97.3 | Ball | Flyout | |
| 1 | Ben Rice | 1-0 | Four-seam | 95.6 | In play, out(s) | Flyout | |
| 1 | Cody Bellinger | 0-0 | Four-seam | 97.1 | Foul | Lineout | |
| 1 | Cody Bellinger | 0-1 | Four-seam | 97.8 | Foul | Lineout | |
| 1 | Cody Bellinger | 0-2 | Changeup | 89.8 | In play, out(s) | Lineout | |
| 1 | Luis García Jr. | 0-0 | Four-seam | 97.3 | Swinging Strike | Strikeout | |
| 1 | Luis García Jr. | 0-1 | Four-seam | 97.0 | Foul | Strikeout | |
| 1 | Luis García Jr. | 0-2 | Changeup | 89.6 | Swinging Strike | Strikeout | |
| 2 | Spencer Jones | 0-0 | Four-seam | 95.4 | Swinging Strike | Flyout | |
| 2 | Spencer Jones | 0-1 | Four-seam | 95.2 | In play, out(s) | Flyout | |
| 2 | George Lombard Jr. | 0-0 | Four-seam | 97.1 | Ball | Groundout | |
| 2 | George Lombard Jr. | 1-0 | Four-seam | 96.4 | Swinging Strike | Groundout | |
| 2 | George Lombard Jr. | 1-1 | Four-seam | 96.9 | In play, out(s) | Groundout | |
| 2 | Jazz Chisholm Jr. | 0-0 | Changeup | 89.8 | Swinging Strike | Strikeout | |
| 2 | Jazz Chisholm Jr. | 0-1 | Four-seam | 95.8 | Foul | Strikeout | |
| 2 | Jazz Chisholm Jr. | 0-2 | Changeup | 86.8 | Ball | Strikeout | |
| 2 | Jazz Chisholm Jr. | 1-2 | Changeup | 89.8 | Foul | Strikeout | |
| 2 | Jazz Chisholm Jr. | 1-2 | Four-seam | 97.2 | Foul | Strikeout | |
| 2 | Jazz Chisholm Jr. | 1-2 | Four-seam | 96.5 | Ball | Strikeout | |
| 2 | Jazz Chisholm Jr. | 2-2 | Changeup | 89.0 | Ball | Strikeout | |
| 2 | Jazz Chisholm Jr. | 3-2 | Four-seam | 97.3 | Foul | Strikeout | |
| 2 | Jazz Chisholm Jr. | 3-2 | Curve | 82.6 | Swinging Strike | Strikeout | |
| 3 | Trent Grisham | 0-0 | Curve | 81.7 | Called Strike | Flyout | |
| 3 | Trent Grisham | 0-1 | Four-seam | 96.8 | In play, out(s) | Flyout | |
| 3 | Austin Wells | 0-0 | Changeup | 88.7 | Called Strike | Strikeout | |
| 3 | Austin Wells | 0-1 | Changeup | 84.6 | Ball | Strikeout | |
| 3 | Austin Wells | 1-1 | Four-seam | 97.8 | Ball | Strikeout | |
| 3 | Austin Wells | 2-1 | Four-seam | 97.2 | Called Strike | Strikeout | |
| 3 | Austin Wells | 2-2 | Four-seam | 97.4 | Foul | Strikeout | |
| 3 | Austin Wells | 2-2 | Changeup | 89.8 | Ball | Strikeout | |
| 3 | Austin Wells | 3-2 | Four-seam | 97.3 | Swinging Strike | Strikeout | |
| 3 | Ryan McMahon | 0-0 | Curve | 82.7 | Called Strike | Pop Out | |
| 3 | Ryan McMahon | 0-1 | Four-seam | 96.2 | Called Strike | Pop Out | |
| 3 | Ryan McMahon | 0-2 | Four-seam | 96.2 | Ball | Pop Out | |
| 3 | Ryan McMahon | 1-2 | Changeup | 88.4 | Ball | Pop Out | |
| 3 | Ryan McMahon | 2-2 | Four-seam | 98.2 | In play, out(s) | Pop Out | |
| 4 | Ben Rice | 0-0 | Four-seam | 95.8 | Called Strike | Home Run | |
| 4 | Ben Rice | 0-1 | Changeup | 88.8 | Ball | Home Run | |
| 4 | Ben Rice | 1-1 | Changeup | 89.0 | Ball | Home Run | |
| 4 | Ben Rice | 2-1 | Changeup | 88.2 | Swinging Strike | Home Run | |
| 4 | Ben Rice | 2-2 | Changeup | 89.8 | In play, run(s) | Home Run | |
| 4 | Cody Bellinger | 0-0 | Four-seam | 96.8 | Foul | Single | |
| 4 | Cody Bellinger | 0-1 | Four-seam | 96.5 | Swinging Strike | Single | |
| 4 | Cody Bellinger | 0-2 | Four-seam | 96.2 | Ball | Single | |
| 4 | Cody Bellinger | 1-2 | Changeup | 87.9 | In play, no out | Single | |
| 4 | Luis García Jr. | 0-0 | Changeup | 87.3 | In play, out(s) | Pop Out | |
| 4 | Spencer Jones | 0-0 | Four-seam | 96.0 | Ball | Forceout | |
| 4 | Spencer Jones | 1-0 | Changeup | 86.9 | In play, out(s) | Forceout | |
| 4 | George Lombard Jr. | 0-0 | Four-seam | 97.0 | Ball | Pop Out | |
| 4 | George Lombard Jr. | 1-0 | Four-seam | 96.4 | In play, out(s) | Pop Out | |
| 5 | Jazz Chisholm Jr. | 0-0 | Four-seam | 96.8 | Foul Tip | Groundout | |
| 5 | Jazz Chisholm Jr. | 0-1 | Changeup | 88.5 | Ball | Groundout | |
| 5 | Jazz Chisholm Jr. | 1-1 | Changeup | 89.0 | In play, out(s) | Groundout | |
| 5 | Trent Grisham | 0-0 | Four-seam | 96.5 | In play, out(s) | Flyout | |
| 5 | Austin Wells | 0-0 | Four-seam | 97.5 | Ball | Double | |
| 5 | Austin Wells | 1-0 | Four-seam | 96.6 | Ball | Double | |
| 5 | Austin Wells | 2-0 | Four-seam | 97.3 | Foul | Double | |
| 5 | Austin Wells | 2-1 | Four-seam | 96.5 | Ball | Double | |
| 5 | Austin Wells | 3-1 | Four-seam | 95.7 | In play, no out | Double | |
| 5 | Ryan McMahon | 0-0 | Four-seam | 97.7 | Swinging Strike | Walk | |
| 5 | Ryan McMahon | 0-1 | Four-seam | 97.3 | Swinging Strike | Walk | |
| 5 | Ryan McMahon | 0-2 | Four-seam | 96.8 | Ball | Walk | |
| 5 | Ryan McMahon | 1-2 | Four-seam | 96.2 | Foul | Walk | |
| 5 | Ryan McMahon | 1-2 | Changeup | 86.7 | Ball | Walk | |
| 5 | Ryan McMahon | 2-2 | Four-seam | 97.3 | Ball | Walk | |
| 5 | Ryan McMahon | 3-2 | Four-seam | 98.0 | Ball | Walk |
Sources, definitions and limitations
The official MLB game record supplies the final score, pitching line and event order. Baseball Savant gamefeed supplies pitch measurements. Statcast Search supplies the regular-season comparison for pitcher 642547. Reporting cutoff: October 6, 2026, 11:30 AM Mountain Time; October 5 game final.
All 66 physical pitches reconcile by unique ID, order and pre-pitch count, with classification comparisons described below, as do 18 batters, 14 recorded outs and 3 strikeouts. Non-pitch actions and automatic calls are excluded from physical-pitch totals. Final plate-appearance outcomes remain separate from individual calls.
Baseline: 2,959 physical pitches in 32 regular-season games, 2026-03-26 through 2026-09-25; target game excluded. No type is removed from pitch-share denominators. Whiff rate means misses divided by swings. Swinging strikes, blocked swinging strikes and foul tips count as misses; swings also include fouls, balls in play and any bunt attempts. Counts accompany small samples. Chase uses the supplied zone flag. The location chart uses catcher-view plate_x and plate_z in feet and the batter’s recorded zone. Statcast documentation defines 2026 location fields at mid-plate and zone boundaries under ABS.
Release speed is in mph; spin is rpm; extension is feet. Induced vertical break, in inches, measures movement relative to a gravity-only path and does not imply that the ball rises. Horizontal movement in the CSV retains the source’s catcher-view signed convention. All outing pitches have speed, spin, extension, movement, location and zone measurements. All 14 balls in play have exit speed; 0 lack launch angle. Missing fields remain blank. Expected batting averages are per-ball rounded tracking estimates, not official aggregate results; this article does not sum them into a predictive claim.
Game rates describe one outing. Pitch selection, measured locations and velocity cannot establish intended targets, hitter expectations, fatigue or injury. Photo credits and source links identify the images.