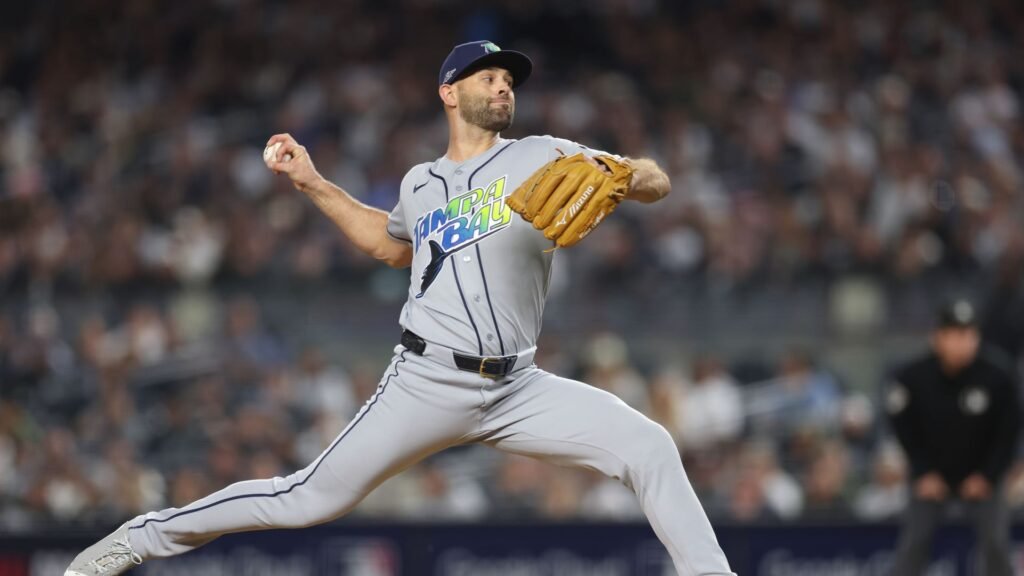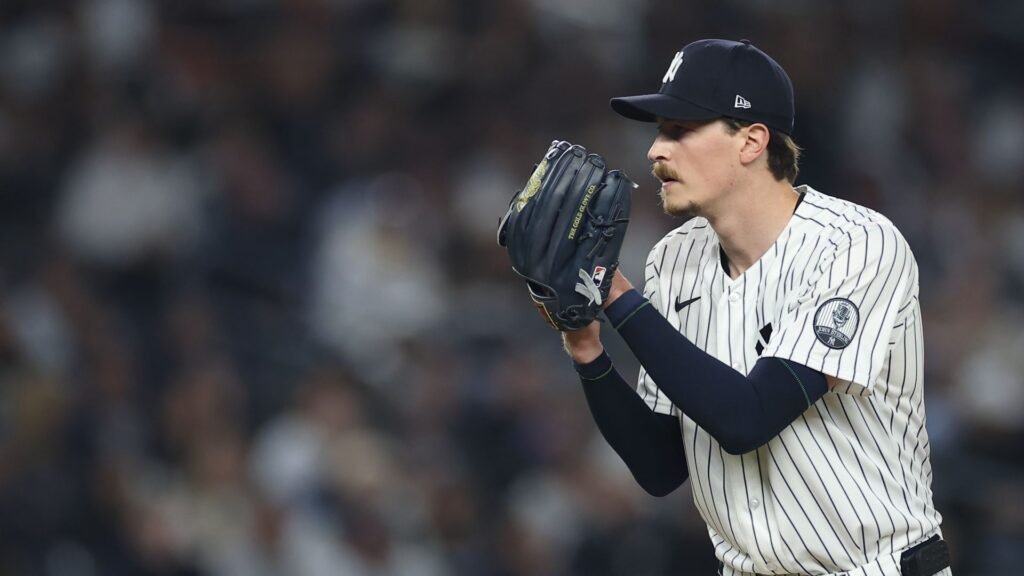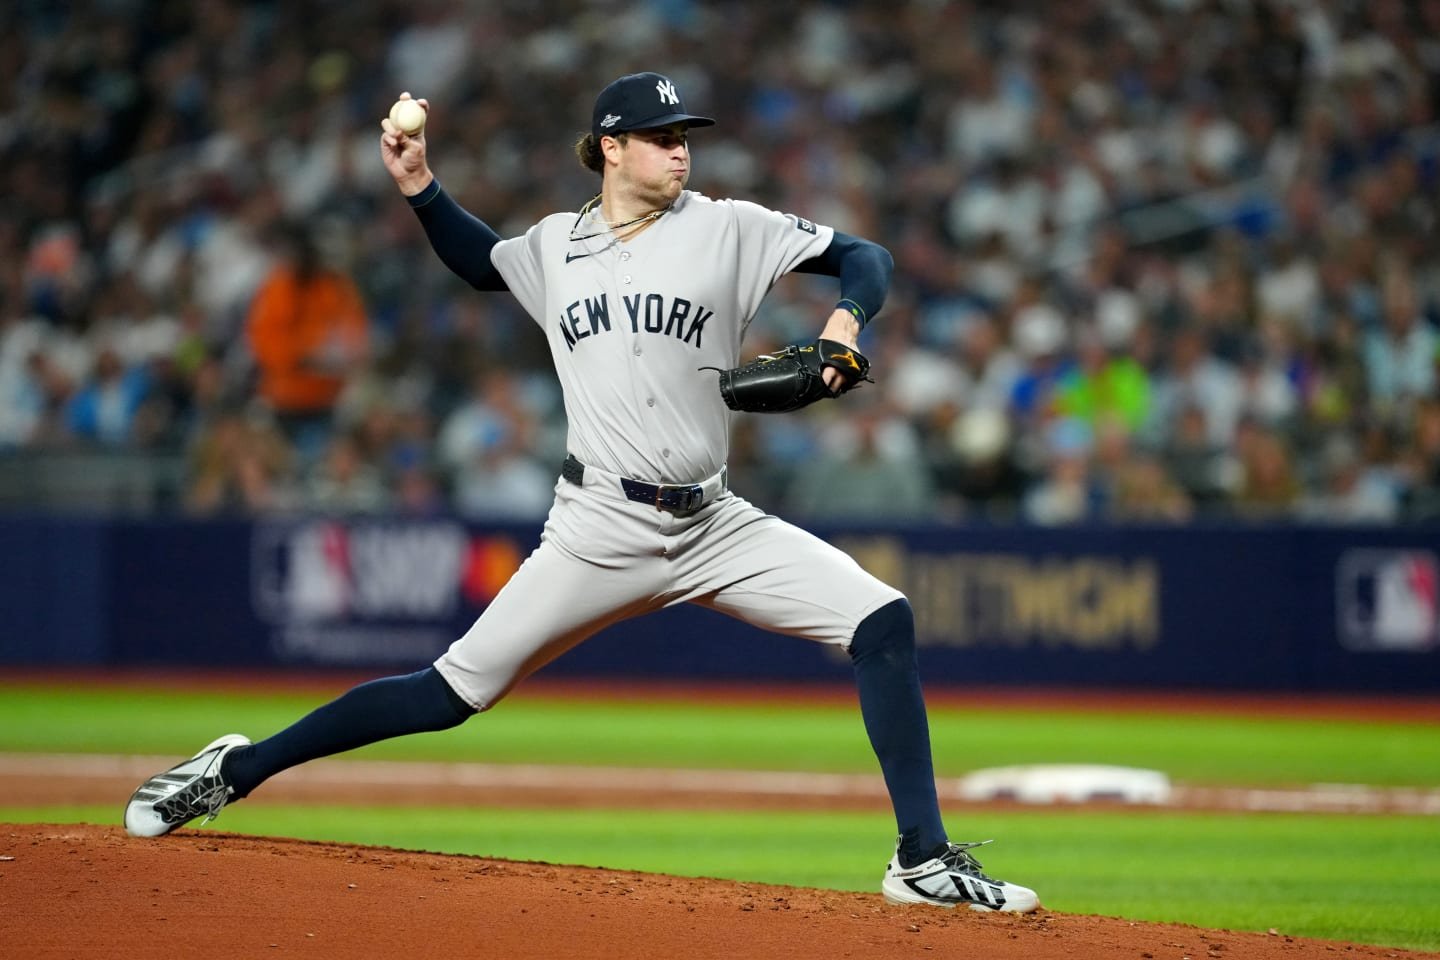
Jonathan Aranda had already missed a cutter when Cam Schlittler reached two strikes in the fifth inning. The next pitch was a 98.0 mph four-seam fastball. Aranda drove it to right field at 109.4 mph for a single. Junior Caminero followed with a first-pitch double off a 96.5 mph sinker, putting runners at second and third before Schlittler recorded an out.
Those consecutive hits explain more about Schlittler's October 5 start than the Yankees' defensive mistakes alone. Tampa Bay won ALDS Game 2, 5-2, at Tropicana Field. Schlittler allowed four runs, two earned, on six hits over 4 1/3 innings, with one walk and two strikeouts. One runner charged to him scored after he left.
Schlittler's four-seamer averaged 98.2 mph, compared with 98.6 in his September 29 Wild Card start against Boston and 98.0 over his regular season. Tampa Bay missed seven times in 44 swings, a 15.9% rate. Boston had missed 24 times in 60 swings, or 40.0%. Different opponents and a smaller sample matter, but the contrast is substantial.
The fastball was still there
Schlittler's previous postseason outing supplied an unusually effective combination of four-seam fastballs and curveballs. The fastball accounted for 55.6% of those 117 pitches and the curve for 27.4%. Against Tampa Bay, the respective shares were 38.2% and 18.4%, while cutters and sinkers took more of the work.
That is a change from Boston, but not a complete departure from his season. Cutters represented 22.4% of Game 2, below their 25.6% regular-season share. The curve remained more common than its 9.8% season rate. The baseline contains 3,041 physical pitches in 33 games, March 27 through September 24, with the postseason kept separate.
The Rays also presented a different set of matchups. Left-handed batters accounted for 51 of his 76 pitches. Against those hitters, he threw four-seamers on 33.3% of pitches, compared with 49.4% in the regular season. That narrower comparison confirms less four-seam use in those matchups; it does not establish why he or the catcher selected another pitch.
Pitch selection: regular season and Game 2
Share of all physical pitches. Scale: 0-50%.
Four-seam
Cutter
Sinker
Curve
Slider
Pitchout
Getting ahead was not the same as finishing
Seventeen of Schlittler's 23 plate appearances began with a recorded strike or contact. He was often able to get ahead. The problem was converting those counts into an out without a ball entering play.
Aranda's fifth-inning single came at 2-2. Earlier, Jonny DeLuca doubled on an 85.6 mph curve after falling behind 0-2 in the second. Tampa Bay put 19 balls in play, including 11 struck at least 95 mph, the Statcast threshold for hard contact. The four-seamer produced two misses in 20 swings; the curve produced three in eight.
Schlittler found useful finishes in the fourth, striking out Richie Palacios on an 85.6 mph curve, then finishing Taylor Walls with a 98.2 mph fastball. Yandy Díaz immediately followed with a 103.0 mph lineout, however, a reminder that the clean inning included another hard ball that the defense converted into an out.
Jonathan Aranda: inning 5
The errors matter, and so does the contact
Ryan McMahon's fielding error started the first inning, and Jazz Chisholm Jr.'s throwing error accompanied Caminero's forceout. Liam Hicks then reached on catcher interference after a challenge overturned the original result. The final plate-appearance record credits no strikeout on that confrontation, even though the pitch record contains a called third strike.
Those plays extended the inning and helped create an unearned run. They cannot explain away Aranda's 103.1 mph first-inning single, DeLuca's double or the consecutive hard hits that opened the fifth. Nor was every scoring ball hard: Hicks drove in a run on a 55.1 mph groundout, and Chandler Simpson's 64.8 mph fielder's choice brought home Caminero.
Schlittler left after Simpson reached, with Tampa Bay ahead 3-1 and Simpson still on base. Simpson later scored on Richie Palacios' single against Brent Headrick. Schlittler's four charged runs therefore differ from both the score at his departure and the Rays' five-run final total.
Contact shaped the result
Schlittler needed 41 pitches for the first two innings, then completed the third and fourth in 21 more. The outing did not end with a clear collapse in four-seam speed. Only one four-seamer was measured in each of the last two innings, so those late averages cannot carry a fatigue diagnosis.
The stronger finding is that Tampa Bay repeatedly made contact against pitches that remained fast enough to resemble his established arsenal. The next useful question is whether he can recover the fastball misses while continuing to get ahead. This record supports that question without attributing every run to defense or treating one opponent's response as a permanent change.
Workload and four-seam speed by inning
| Inning | Pitches | Cumulative | Four-seam mph | Four-seam n | Outs recorded |
|---|---|---|---|---|---|
| 1 | 19 | 19 | 98.1 | 10 | 3 |
| 2 | 22 | 41 | 98.4 | 15 | 3 |
| 3 | 12 | 53 | 97.8 | 2 | 3 |
| 4 | 9 | 62 | 98.2 | 1 | 3 |
| 5* | 14 | 76 | 98.0 | 1 | 1 |
All 76 pitches
Filter the complete outing and select any pitch for its measurements. Pitch result and completed plate-appearance outcome are separate columns.
76 of 76 pitches
No pitches match these filters.
| Pitch | Inning | Hitter | Count before | Tracking type | mph | Pitch result | PA outcome |
|---|---|---|---|---|---|---|---|
| 1 | Yandy Díaz | 0-0 | Four-seam | 97.5 | Called Strike | Field Error | |
| 1 | Yandy Díaz | 0-1 | Four-seam | 98.0 | In play, no out | Field Error | |
| 1 | Jonathan Aranda | 0-0 | Four-seam | 97.8 | In play, no out | Single | |
| 1 | Junior Caminero | 0-0 | Four-seam | 99.4 | Foul | Forceout | |
| 1 | Junior Caminero | 0-1 | Curve | 85.8 | Ball In Dirt | Forceout | |
| 1 | Junior Caminero | 1-1 | Four-seam | 97.8 | Called Strike | Forceout | |
| 1 | Junior Caminero | 1-2 | Curve | 86.0 | Foul | Forceout | |
| 1 | Junior Caminero | 1-2 | Sinker | 97.7 | Ball In Dirt | Forceout | |
| 1 | Junior Caminero | 2-2 | Four-seam | 98.7 | Foul | Forceout | |
| 1 | Junior Caminero | 2-2 | Cutter | 94.7 | In play, run(s) | Forceout | |
| 1 | Liam Hicks | 0-0 | Cutter | 94.1 | Called Strike | Catcher Interference | |
| 1 | Liam Hicks | 0-1 | Cutter | 94.4 | Called Strike | Catcher Interference | |
| 1 | Liam Hicks | 0-2 | Four-seam | 98.1 | Called Strike | Catcher Interference | |
| 1 | Chandler Simpson | 0-0 | Sinker | 98.6 | Called Strike | Forceout | |
| 1 | Chandler Simpson | 0-1 | Four-seam | 98.2 | In play, out(s) | Forceout | |
| 1 | Victor Mesa Jr. | 0-0 | Curve | 85.0 | Swinging Strike | Groundout | |
| 1 | Victor Mesa Jr. | 0-1 | Four-seam | 97.5 | Foul | Groundout | |
| 1 | Victor Mesa Jr. | 0-2 | Four-seam | 97.8 | Foul | Groundout | |
| 1 | Victor Mesa Jr. | 0-2 | Curve | 85.1 | In play, out(s) | Groundout | |
| 2 | Jonny DeLuca | 0-0 | Four-seam | 97.1 | Swinging Strike | Double | |
| 2 | Jonny DeLuca | 0-1 | Four-seam | 97.6 | Foul | Double | |
| 2 | Jonny DeLuca | 0-2 | Curve | 85.6 | In play, no out | Double | |
| 2 | Richie Palacios | 0-0 | Four-seam | 98.5 | Ball | Groundout | |
| 2 | Richie Palacios | 1-0 | Four-seam | 98.2 | Foul | Groundout | |
| 2 | Richie Palacios | 1-1 | Four-seam | 98.7 | Foul | Groundout | |
| 2 | Richie Palacios | 1-2 | Four-seam | 98.0 | In play, out(s) | Groundout | |
| 2 | Taylor Walls | 0-0 | Cutter | 94.6 | Ball | Groundout | |
| 2 | Taylor Walls | 1-0 | Cutter | 95.2 | Foul | Groundout | |
| 2 | Taylor Walls | 1-1 | Four-seam | 98.8 | In play, out(s) | Groundout | |
| 2 | Yandy Díaz | 0-0 | Four-seam | 98.1 | Called Strike | Walk | |
| 2 | Yandy Díaz | 0-1 | Four-seam | 98.0 | Ball | Walk | |
| 2 | Yandy Díaz | 1-1 | Four-seam | 98.9 | Ball | Walk | |
| 2 | Yandy Díaz | 2-1 | Sinker | 99.0 | Called Strike | Walk | |
| 2 | Yandy Díaz | 2-2 | Four-seam | 98.4 | Foul | Walk | |
| 2 | Yandy Díaz | 2-2 | Four-seam | 98.8 | Ball | Walk | |
| 2 | Yandy Díaz | 3-2 | Sinker | 98.9 | Foul | Walk | |
| 2 | Yandy Díaz | 3-2 | Cutter | 94.8 | Ball | Walk | |
| 2 | Jonathan Aranda | 0-0 | Four-seam | 98.8 | Foul | Groundout | |
| 2 | Jonathan Aranda | 0-1 | Four-seam | 98.7 | Ball | Groundout | |
| 2 | Jonathan Aranda | 1-1 | Four-seam | 99.1 | Foul | Groundout | |
| 2 | Jonathan Aranda | 1-2 | Sinker | 99.4 | In play, out(s) | Groundout | |
| 3 | Junior Caminero | 0-0 | Curve | 86.3 | Swinging Strike | Single | |
| 3 | Junior Caminero | 0-1 | Cutter | 94.1 | In play, no out | Single | |
| 3 | Liam Hicks | 0-0 | Curve | 85.8 | Called Strike | Pop Out | |
| 3 | Liam Hicks | 0-1 | Cutter | 94.1 | In play, out(s) | Pop Out | |
| 3 | Chandler Simpson | 0-0 | Sinker | 98.0 | Ball | Single | |
| 3 | Chandler Simpson | 1-0 | Sinker | 98.5 | Ball | Single | |
| 3 | Chandler Simpson | 2-0 | Four-seam | 97.5 | In play, no out | Single | |
| 3 | Victor Mesa Jr. | 0-0 | Sinker | 97.7 | Ball | Lineout | |
| 3 | Victor Mesa Jr. | 1-0 | Cutter | 95.1 | Ball In Dirt | Lineout | |
| 3 | Victor Mesa Jr. | 2-0 | Curve | 85.3 | Foul | Lineout | |
| 3 | Victor Mesa Jr. | 2-1 | Four-seam | 98.1 | In play, out(s) | Lineout | |
| 3 | Jonny DeLuca | 0-0 | Sinker | 97.6 | In play, out(s) | Forceout | |
| 4 | Richie Palacios | 0-0 | Curve | 86.0 | Called Strike | Strikeout | |
| 4 | Richie Palacios | 0-1 | Cutter | 92.9 | Foul | Strikeout | |
| 4 | Richie Palacios | 0-2 | Curve | 85.6 | Swinging Strike (Blocked) | Strikeout | |
| 4 | Taylor Walls | 0-0 | Curve | 85.3 | Ball | Strikeout | |
| 4 | Taylor Walls | 1-0 | Curve | 84.2 | Foul | Strikeout | |
| 4 | Taylor Walls | 1-1 | Cutter | 94.2 | Ball | Strikeout | |
| 4 | Taylor Walls | 2-1 | Cutter | 93.5 | Called Strike | Strikeout | |
| 4 | Taylor Walls | 2-2 | Four-seam | 98.2 | Swinging Strike | Strikeout | |
| 4 | Yandy Díaz | 0-0 | Cutter | 95.1 | In play, out(s) | Lineout | |
| 5 | Jonathan Aranda | 0-0 | Cutter | 92.4 | Swinging Strike | Single | |
| 5 | Jonathan Aranda | 0-1 | Curve | 85.3 | Ball | Single | |
| 5 | Jonathan Aranda | 1-1 | Curve | 84.7 | Ball | Single | |
| 5 | Jonathan Aranda | 2-1 | Cutter | 93.5 | Called Strike | Single | |
| 5 | Jonathan Aranda | 2-2 | Four-seam | 98.0 | In play, no out | Single | |
| 5 | Junior Caminero | 0-0 | Sinker | 96.5 | In play, no out | Double | |
| 5 | Liam Hicks | 0-0 | Cutter | 94.7 | Foul | Groundout | |
| 5 | Liam Hicks | 0-1 | Cutter | 94.6 | In play, run(s) | Groundout | |
| 5 | Chandler Simpson | 0-0 | Sinker | 98.1 | Ball | Fielders Choice | |
| 5 | Chandler Simpson | 1-0 | Sinker | 97.6 | Foul Tip | Fielders Choice | |
| 5 | Chandler Simpson | 1-1 | Sinker | 98.3 | Foul | Fielders Choice | |
| 5 | Chandler Simpson | 1-2 | Sinker | 98.0 | Ball | Fielders Choice | |
| 5 | Chandler Simpson | 2-2 | Sinker | 98.0 | Ball | Fielders Choice | |
| 5 | Chandler Simpson | 3-2 | Sinker | 98.3 | In play, run(s) | Fielders Choice |
Sources, definitions and limitations
The official MLB game record supplies the final score, pitching line and event order. Baseball Savant gamefeed supplies pitch measurements. Statcast Search supplies the regular-season comparison for pitcher 693645. Reporting cutoff: October 6, 2026, 11:30 AM Mountain Time; October 5 game final.
All 76 physical pitches reconcile by unique ID, order and pre-pitch count, with classification comparisons described below, as do 23 batters, 13 recorded outs and 2 strikeouts. Non-pitch actions and automatic calls are excluded from physical-pitch totals. Final plate-appearance outcomes remain separate from individual calls. One tracking-feed label in this outing shortened a blocked swinging strike. The ledger retains the official MLB blocked description; swing and miss totals are unchanged. The September 29 Boston comparison is a separate postseason game, ID 849851, freshly retrieved and reconciled to its 117-pitch box score. It is excluded from the regular-season sample. The overturned Hicks plate appearance retains catcher interference as its final outcome.
Baseline: 3,041 physical pitches in 33 regular-season games, 2026-03-27 through 2026-09-24; target game excluded. No type is removed from pitch-share denominators. Whiff rate means misses divided by swings. Swinging strikes, blocked swinging strikes and foul tips count as misses; swings also include fouls, balls in play and any bunt attempts. Counts accompany small samples. Chase uses the supplied zone flag. The location chart uses catcher-view plate_x and plate_z in feet and the batter’s recorded zone. Statcast documentation defines 2026 location fields at mid-plate and zone boundaries under ABS.
Release speed is in mph; spin is rpm; extension is feet. Induced vertical break, in inches, measures movement relative to a gravity-only path and does not imply that the ball rises. Horizontal movement in the CSV retains the source’s catcher-view signed convention. All outing pitches have speed, spin, extension, movement, location and zone measurements. All 19 balls in play have exit speed; 2 lack launch angle. Missing fields remain blank. Expected batting averages are per-ball rounded tracking estimates, not official aggregate results; this article does not sum them into a predictive claim.
Game rates describe one outing. Pitch selection, measured locations and velocity cannot establish intended targets, hitter expectations, fatigue or injury. Photo credits and source links identify the images.