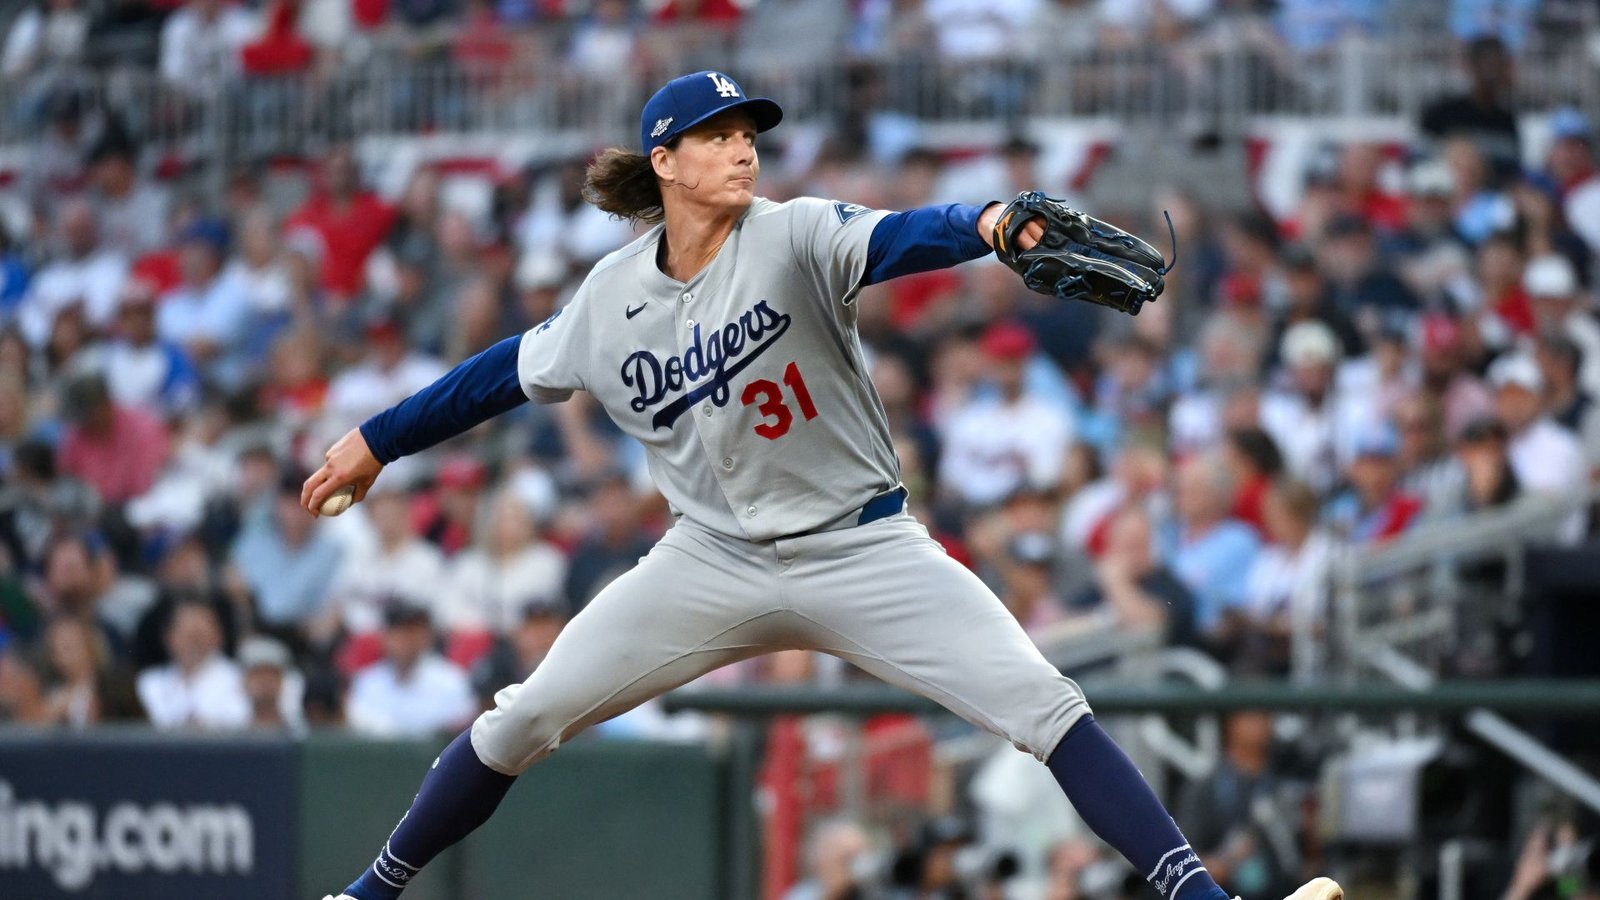
Ronald Acuña Jr. reached a 3–1 count in the first inning against Tyler Glasnow, then fouled off a 96.5-mph four-seamer. Glasnow came back with another at 98.4 mph for a called third strike. The six-pitch confrontation recovered from three balls, but that recovery was not something he repeated every time Atlanta waited him out.
Glasnow allowed one hit and one run over 4 2/3 innings in the Dodgers’ 4–1 win at Truist Park on Wednesday, October 7. Los Angeles closed the NLDS in four games. His five strikeouts came with five walks, leaving a pitching line whose limited hits did not capture the number of runners he put aboard.
The complete 78-pitch record shows a larger share of a harder four-seam fastball than in his regular season. It also shows fewer misses per swing and hard contact that often became outs. Those observations help explain how Atlanta could threaten a pitcher it hardly hit safely.
Regular season and Game 4
Share of all physical pitches. Scale: 0–50%.
Four-seam
Slider
Knuckle-curve
Sinker
Curve
A larger four-seam share
Glasnow threw 36 four-seamers, 46.2% of his pitches, compared with 34.7% across 1,149 physical pitches in 13 regular-season starts. The pitch averaged 96.8 mph, up from 95.5 mph in that comparison. He used 16 sliders, 15 knuckle-curves and 11 sinkers; the season’s separately classified curveball did not appear in this outing.
The opening Acuña sequence shows the pitches doing different jobs. An 80.3-mph knuckle-curve began with a ball. A sinker supplied a called strike before another sinker and a slider took the count to 3–1. The two four-seamers finished the at-bat. The strikeout belonged to the sequence, including a take, rather than to a string of missed swings.
Across the outing, Atlanta missed seven of 31 swings, a 22.6% whiff rate. Glasnow’s regular-season sample produced 156 misses in 486 swings, 32.1%. His slider accounted for three misses in six swings; the four-seamer also produced three, from 17 swings. These are descriptive samples against one lineup, not proof of a lasting repertoire change.
Ronald Acuña Jr.: inning 1
Walks and contact kept the inning alive
Michael Harris II hit Glasnow’s first pitch, a 96.2-mph four-seamer, for a 106.8-mph single. It remained Atlanta’s only hit against him. Five of the 10 balls put in play nevertheless reached the 95-mph hard-hit threshold, including Ozzie Albies’ 104.5-mph lineout and Matt Olson’s 101.7-mph flyout. One hit was the outcome; uniformly weak contact was not the process.
Five walks created a separate route onto the bases. Glasnow threw 34 balls, and only 10 of his 20 batters faced received a first-pitch strike. His inning-by-inning four-seam averages fluctuated rather than declining steadily, from 97.6 mph in the first to 97.5 in the fourth and 96.4 in the fifth. That record does not establish fatigue or explain a missed target.
He left a 1–1 game with two outs in the fifth, Austin Riley on second and Acuña on first. Alex Vesia stranded both runners, resolving Glasnow’s final line at one earned run. Whether Glasnow can pair this faster four-seamer with fewer walks is the next question the record raises; the low hit total alone cannot answer it.
Workload and four-seam speed by inning
| Inning | Pitches | Cumulative | Four-seam mph | Four-seam n | Outs recorded |
|---|---|---|---|---|---|
| 1 | 15 | 15 | 97.6 | 4 | 3 |
| 2 | 18 | 33 | 96.1 | 8 | 3 |
| 3 | 15 | 48 | 96.7 | 8 | 3 |
| 4 | 13 | 61 | 97.5 | 7 | 3 |
| 5* | 17 | 78 | 96.4 | 9 | 2 |
All 78 pitches
Filter the complete outing and select any pitch for its measurements. Pitch result and completed plate-appearance outcome are separate columns.
78 of 78 pitches
No pitches match these filters.
| Pitch | Inning | Hitter | Count before | Type | mph | Pitch result | PA outcome |
|---|---|---|---|---|---|---|---|
| 1 | Michael Harris II | 0-0 | Four-seam | 96.2 | In play, no out | Single | |
| 1 | Ronald Acuña Jr. | 0-0 | Knuckle-curve | 80.3 | Ball | Strikeout | |
| 1 | Ronald Acuña Jr. | 1-0 | Sinker | 95.9 | Called Strike | Strikeout | |
| 1 | Ronald Acuña Jr. | 1-1 | Sinker | 95.9 | Ball | Strikeout | |
| 1 | Ronald Acuña Jr. | 2-1 | Slider | 89.8 | Ball | Strikeout | |
| 1 | Ronald Acuña Jr. | 3-1 | Four-seam | 96.5 | Foul | Strikeout | |
| 1 | Ronald Acuña Jr. | 3-2 | Four-seam | 98.4 | Called Strike | Strikeout | |
| 1 | Matt Olson | 0-0 | Knuckle-curve | 80.8 | Ball | Groundout | |
| 1 | Matt Olson | 1-0 | Sinker | 98.3 | Ball | Groundout | |
| 1 | Matt Olson | 2-0 | Sinker | 97.7 | In play, out(s) | Groundout | |
| 1 | Ozzie Albies | 0-0 | Knuckle-curve | 81.8 | Foul | Groundout | |
| 1 | Ozzie Albies | 0-1 | Four-seam | 99.2 | Foul | Groundout | |
| 1 | Ozzie Albies | 0-2 | Knuckle-curve | 84.9 | Ball | Groundout | |
| 1 | Ozzie Albies | 1-2 | Knuckle-curve | 82.1 | Foul | Groundout | |
| 1 | Ozzie Albies | 1-2 | Sinker | 97.7 | In play, out(s) | Groundout | |
| 2 | Drake Baldwin | 0-0 | Four-seam | 95.4 | Ball | Flyout | |
| 2 | Drake Baldwin | 1-0 | Sinker | 96.0 | Ball | Flyout | |
| 2 | Drake Baldwin | 2-0 | Four-seam | 95.4 | Foul | Flyout | |
| 2 | Drake Baldwin | 2-1 | Slider | 89.2 | In play, out(s) | Flyout | |
| 2 | Mike Yastrzemski | 0-0 | Slider | 92.0 | Ball | Groundout | |
| 2 | Mike Yastrzemski | 1-0 | Four-seam | 97.9 | Ball | Groundout | |
| 2 | Mike Yastrzemski | 2-0 | Four-seam | 97.0 | In play, out(s) | Groundout | |
| 2 | Mauricio Dubón | 0-0 | Four-seam | 94.9 | Ball | Walk | |
| 2 | Mauricio Dubón | 1-0 | Four-seam | 95.3 | Foul | Walk | |
| 2 | Mauricio Dubón | 1-1 | Slider | 91.3 | Ball | Walk | |
| 2 | Mauricio Dubón | 2-1 | Sinker | 96.0 | Foul | Walk | |
| 2 | Mauricio Dubón | 2-2 | Knuckle-curve | 82.2 | Ball | Walk | |
| 2 | Mauricio Dubón | 3-2 | Four-seam | 96.1 | Ball | Walk | |
| 2 | Austin Riley | 0-0 | Knuckle-curve | 80.5 | Ball In Dirt | Strikeout | |
| 2 | Austin Riley | 1-0 | Sinker | 98.0 | Called Strike | Strikeout | |
| 2 | Austin Riley | 1-1 | Slider | 91.0 | Swinging Strike | Strikeout | |
| 2 | Austin Riley | 1-2 | Slider | 92.9 | Ball | Strikeout | |
| 2 | Austin Riley | 2-2 | Four-seam | 97.1 | Swinging Strike | Strikeout | |
| 3 | Sean Murphy | 0-0 | Slider | 89.8 | Ball | Flyout | |
| 3 | Sean Murphy | 1-0 | Four-seam | 97.1 | Called Strike | Flyout | |
| 3 | Sean Murphy | 1-1 | Four-seam | 97.7 | Called Strike | Flyout | |
| 3 | Sean Murphy | 1-2 | Slider | 92.1 | Foul | Flyout | |
| 3 | Sean Murphy | 1-2 | Four-seam | 97.4 | Foul | Flyout | |
| 3 | Sean Murphy | 1-2 | Knuckle-curve | 83.7 | Ball | Flyout | |
| 3 | Sean Murphy | 2-2 | Four-seam | 96.7 | In play, out(s) | Flyout | |
| 3 | Michael Harris II | 0-0 | Knuckle-curve | 81.2 | Ball | Walk | |
| 3 | Michael Harris II | 1-0 | Four-seam | 96.2 | Ball | Walk | |
| 3 | Michael Harris II | 2-0 | Slider | 89.3 | Ball | Walk | |
| 3 | Michael Harris II | 3-0 | Four-seam | 96.2 | Ball | Walk | |
| 3 | Ronald Acuña Jr. | 0-0 | Four-seam | 95.5 | Foul | Strikeout | |
| 3 | Ronald Acuña Jr. | 0-1 | Slider | 88.9 | Called Strike | Strikeout | |
| 3 | Ronald Acuña Jr. | 0-2 | Slider | 91.1 | Foul Tip | Strikeout | |
| 3 | Matt Olson | 0-0 | Four-seam | 96.8 | In play, out(s) | Flyout | |
| 4 | Ozzie Albies | 0-0 | Slider | 88.3 | Called Strike | Lineout | |
| 4 | Ozzie Albies | 0-1 | Knuckle-curve | 82.7 | Foul | Lineout | |
| 4 | Ozzie Albies | 0-2 | Four-seam | 98.5 | In play, out(s) | Lineout | |
| 4 | Drake Baldwin | 0-0 | Four-seam | 97.2 | Swinging Strike | Strikeout | |
| 4 | Drake Baldwin | 0-1 | Four-seam | 98.3 | Called Strike | Strikeout | |
| 4 | Drake Baldwin | 0-2 | Knuckle-curve | 84.2 | Swinging Strike | Strikeout | |
| 4 | Mike Yastrzemski | 0-0 | Four-seam | 97.7 | Ball | Walk | |
| 4 | Mike Yastrzemski | 1-0 | Four-seam | 97.1 | Called Strike | Walk | |
| 4 | Mike Yastrzemski | 1-1 | Sinker | 97.9 | Ball | Walk | |
| 4 | Mike Yastrzemski | 2-1 | Knuckle-curve | 82.9 | Ball | Walk | |
| 4 | Mike Yastrzemski | 3-1 | Four-seam | 96.3 | Foul Tip | Walk | |
| 4 | Mike Yastrzemski | 3-2 | Four-seam | 97.5 | Ball | Walk | |
| 4 | Mauricio Dubón | 0-0 | Slider | 91.7 | In play, out(s) | Flyout | |
| 5 | Austin Riley | 0-0 | Four-seam | 94.8 | Called Strike | Walk | |
| 5 | Austin Riley | 0-1 | Slider | 91.6 | Swinging Strike | Walk | |
| 5 | Austin Riley | 0-2 | Four-seam | 96.9 | Foul | Walk | |
| 5 | Austin Riley | 0-2 | Four-seam | 95.9 | Ball | Walk | |
| 5 | Austin Riley | 1-2 | Knuckle-curve | 82.6 | Ball | Walk | |
| 5 | Austin Riley | 2-2 | Four-seam | 96.6 | Ball | Walk | |
| 5 | Austin Riley | 3-2 | Four-seam | 95.7 | Ball | Walk | |
| 5 | Sean Murphy | 0-0 | Sinker | 95.3 | Called Strike | Lineout | |
| 5 | Sean Murphy | 0-1 | Knuckle-curve | 80.9 | Called Strike | Lineout | |
| 5 | Sean Murphy | 0-2 | Four-seam | 96.7 | In play, out(s) | Lineout | |
| 5 | Michael Harris II | 0-0 | Knuckle-curve | 81.3 | Foul | Strikeout | |
| 5 | Michael Harris II | 0-1 | Four-seam | 96.8 | Foul | Strikeout | |
| 5 | Michael Harris II | 0-2 | Sinker | 97.4 | Called Strike | Strikeout | |
| 5 | Ronald Acuña Jr. | 0-0 | Slider | 93.4 | Ball | Walk | |
| 5 | Ronald Acuña Jr. | 1-0 | Slider | 91.2 | Ball | Walk | |
| 5 | Ronald Acuña Jr. | 2-0 | Four-seam | 96.2 | Ball | Walk | |
| 5 | Ronald Acuña Jr. | 3-0 | Four-seam | 97.9 | Ball | Walk |
Sources, definitions and limitations
The official MLB final record supplies the score, pitching line, play order and calls. Baseball Savant’s complete gamefeed supplies pitch tracking. Statcast Search supplies the pregame regular-season comparison. Reporting cutoff: October 7, 2026 at 8:58 PM Mountain Time. NLDS Game 4 was final.
All 78 physical pitches reconcile by unique ID, order, type, call and pre-pitch count, including any count-changing non-pitch events. The audit also reconciles 20 batters, 14 integer outs and 5 strikeouts. Baseball innings notation counts outs: .1 is one out and .2 is two. Automatic calls, intentional-walk records and non-pitch actions are excluded from physical-pitch totals.
The primary baseline contains 1,149 physical pitches in 13 regular-season appearances, including 13 starts, 2026-03-28 through 2026-09-24. Its game IDs and per-game totals reconcile to the official log. Postseason games are separate. Team and starter-only comparisons are identified in the prose. Small role samples do not establish stable trends.
Whiff rate means misses divided by swings. Swinging strikes, blocked swinging strikes and caught foul tips count as misses, matching Savant’s supplied summary. Fouls, balls in play and bunt attempts also count as swings. Called strikes and strikeout plate appearances are separate. Hard-hit means measured exit speed of at least 95 mph. Per-ball expected batting averages are Savant model estimates, not actual outcomes or an official aggregate.
Speed is mph, spin rpm, extension feet and induced vertical break inches relative to a gravity-only path. The pitch-detail panel distinguishes source zone flags, measured ball-center locations and official calls. The chart uses catcher-view locations in feet with the batter’s recorded zone boundaries. See Statcast field definitions. All outing pitches have speed, spin, extension, induced vertical break and plate coordinates. All 10 balls in play have measured exit speed and launch angle; non-contact fields remain blank on other pitches.
This is descriptive analysis of one completed outing. The measured record cannot establish intended targets, hitter expectations, fatigue or injury. Opponent handedness, count opportunities and short opener assignments can affect pitch selection. Photographs identify their source event; no comments or interviews have been inferred from tracking data.