
College Sports
Florida’s Offensive Slump Goes Beyond the Quarterback Debate
The Gators’ scoring has fallen by two-thirds across two four-game stretches. Their completion rates alone cannot explain the decline.
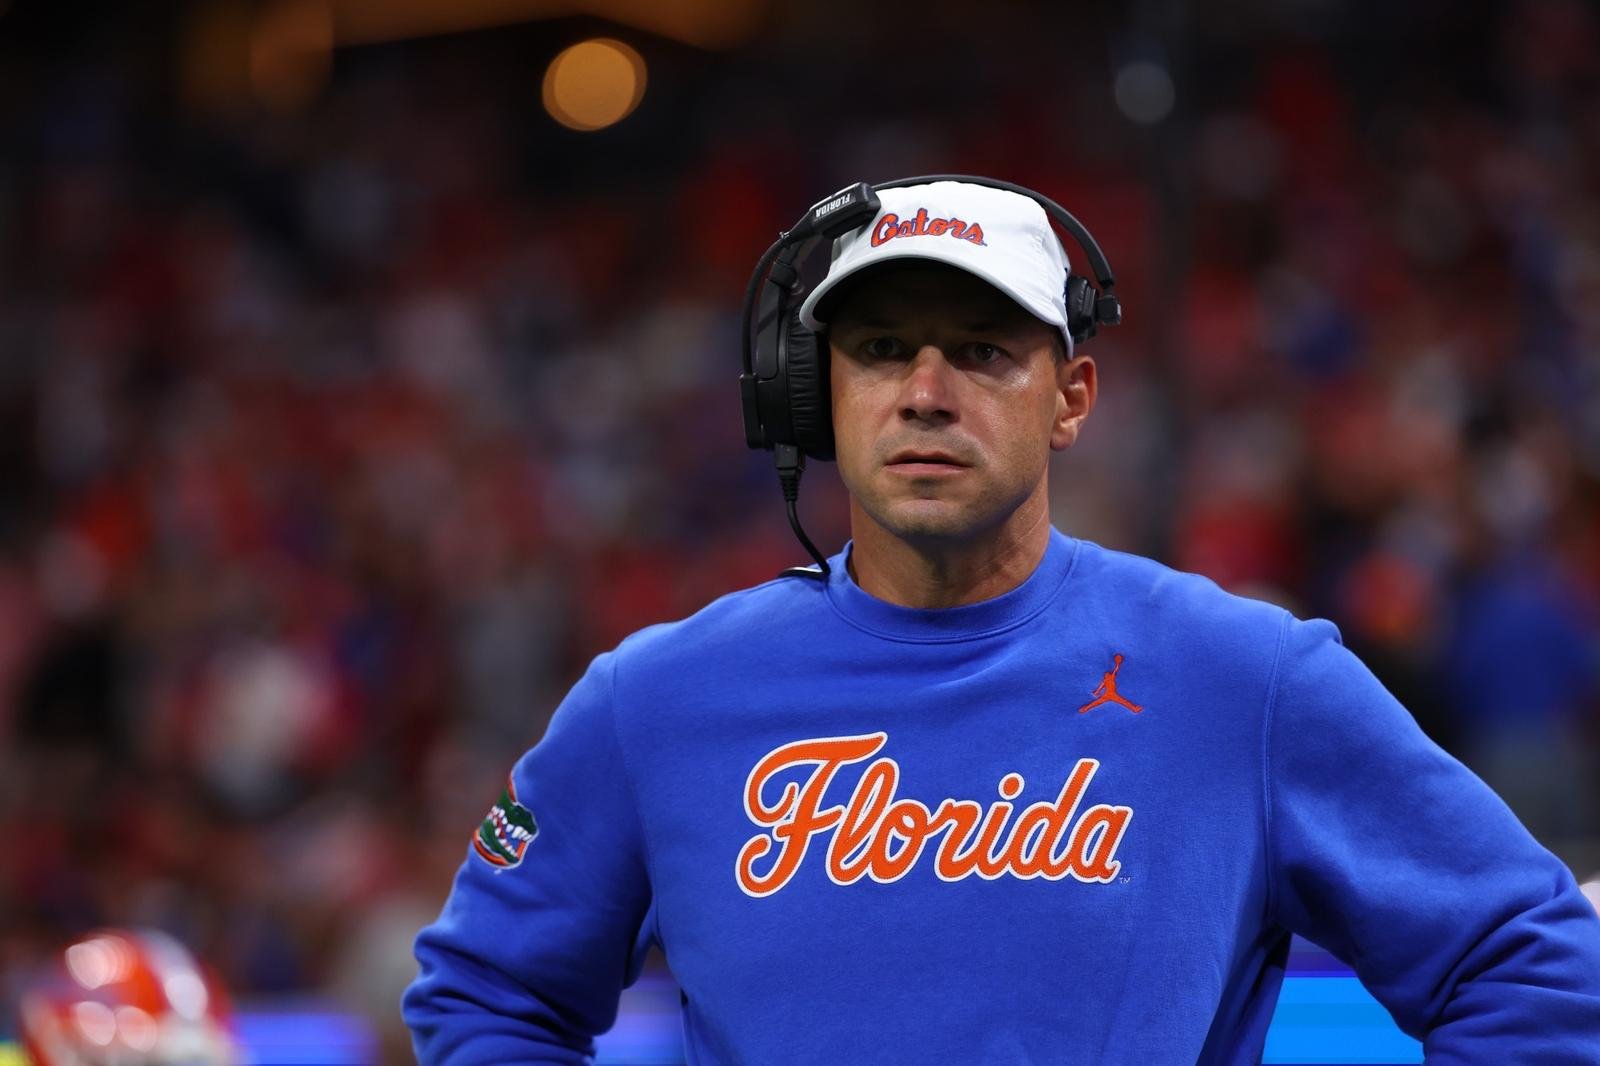
Florida’s offense has lost roughly two-thirds of its scoring across the season’s two four-game stretches. Deciding between Aaron Philo and Tramell Jones Jr. is part of the response, but the Gators’ numbers show why a similar completion percentage does not make the quarterbacks interchangeable or explain the entire decline.
Florida scored 214 points while opening 4–0, then 71 while going 1–3 against Missouri, South Carolina, Texas and Georgia. Those equal-sized blocks work out to 53.5 and 17.75 points per game, a 66.8% reduction calculated from the official final scores.
Total offense has also fallen. Florida’s November 2 team report gives averages of 532.8 yards in the first four games and 319.3 in the next four, a drop of about 40%. The loss of yardage is substantial, but scoring has fallen even faster.
What the four-game split does and does not show
| Measure | First four | Next four |
|---|---|---|
| Record | 4–0 | 1–3 |
| Team points | 214 | 71 |
| Points per game | 53.5 | 17.8 |
| Total offense per game | 532.8 yards | 319.3 yards |
The scoring comparison uses team points from every source. It is not an opponent-adjusted measure of offensive efficiency, and it does not isolate starting field position or non-offensive scores. The first stretch included Florida Atlantic and Campbell as well as Auburn and Ole Miss; the second consisted entirely of SEC opponents.
That difference in schedule prevents treating the 4–0 start as a neutral expectation for every later game. It also prevents assigning a specific share of the decline to one injured receiver or one quarterback decision.
Similar accuracy, different production
Through eight games, Philo completed 110 of 156 passes and Jones 63 of 89. Their completion rates are almost identical, at 70.5% and 70.8%, but Philo’s 1,367 passing yards produce 8.8 yards per attempt. Jones’ 579 produce 6.5.
| Quarterback | Completions/attempts | Yards/attempt | TD/INT |
|---|---|---|---|
| Aaron Philo | 110/156 | 8.8 | 9/5 |
| Tramell Jones Jr. | 63/89 | 6.5 | 4/3 |
Those are season totals, not a controlled comparison against the same defenses in the same situations. Jones has fewer attempts, and both players have appeared in seven games. The gap in yards per attempt describes what happened; it cannot, by itself, settle who would perform better on the next snap.
The Georgia game shows another limitation of completion rate. Florida completed 23 of 32 passes collectively, yet scored only eight points. Philo threw two first-half interceptions, and a Jones fumble was returned 66 yards for a touchdown before halftime. Georgia led 24–0 at the break.
A completed pass percentage can coexist with possessions lost to turnovers and an offense struggling to create points. The two quarterbacks contributed differently to that game, but neither changed its overall outcome.
The personnel problem around the position
Receiver Vernell Brown III’s knee injury removes a player who had 17 catches for 271 yards and two touchdowns before he was hurt. Coach Jon Sumrall said Brown suffered a setback in practice last week. Florida’s official reporting also describes a receiving group whose leading options have had limited opportunities to play together.
Sumrall said Jones was not fully healthy either, while both quarterbacks practiced Monday. That makes the selection question one of availability as well as production. It does not establish that either player is cleared of every physical limitation.
The evidence supports a broader explanation than a change at quarterback alone: reduced yardage, costly lost possessions and disrupted personnel have arrived together. The next useful comparison is whether Florida can turn its completions into sustained drives and points with the players actually available, rather than whether one quarterback can reproduce September’s scoring average against a different schedule.
Sources and notes
- Florida 2026 official cumulative statistics, through October 31: https://floridagators.com/sports/football/stats/2026
- Florida–Georgia official October 31 box score and play-by-play: https://floridagators.com/sports/football/stats/2026/georgia/boxscore/27910
- Florida official November 2 report, Ryan Roddy: https://floridagators.com/news/2026/11/2/football-gators-look-to-reignite-offense-amid-qb-battle-browns-injury