
MLB · Pitching Data
How Milwaukee broke through against Tyler Glasnow after 10 straight outs
Glasnow retired his first 10 hitters, then allowed five of his last eight to reach. The pitch record explains how six strikeouts coexisted with a low miss rate, and how Milwaukee turned two walks into scoring opportunities.
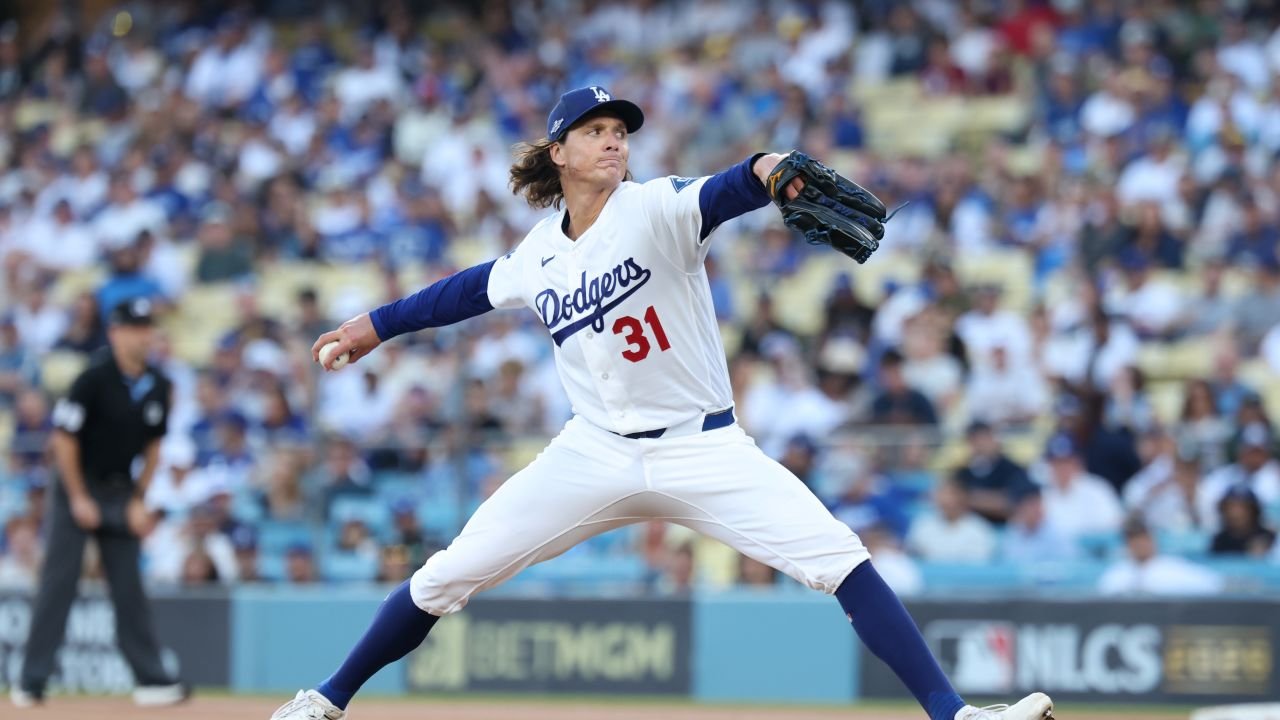
Los Angeles Dodgers · Tyler Glasnow · NLCS Game 4
Ten straight outs, then five baserunners
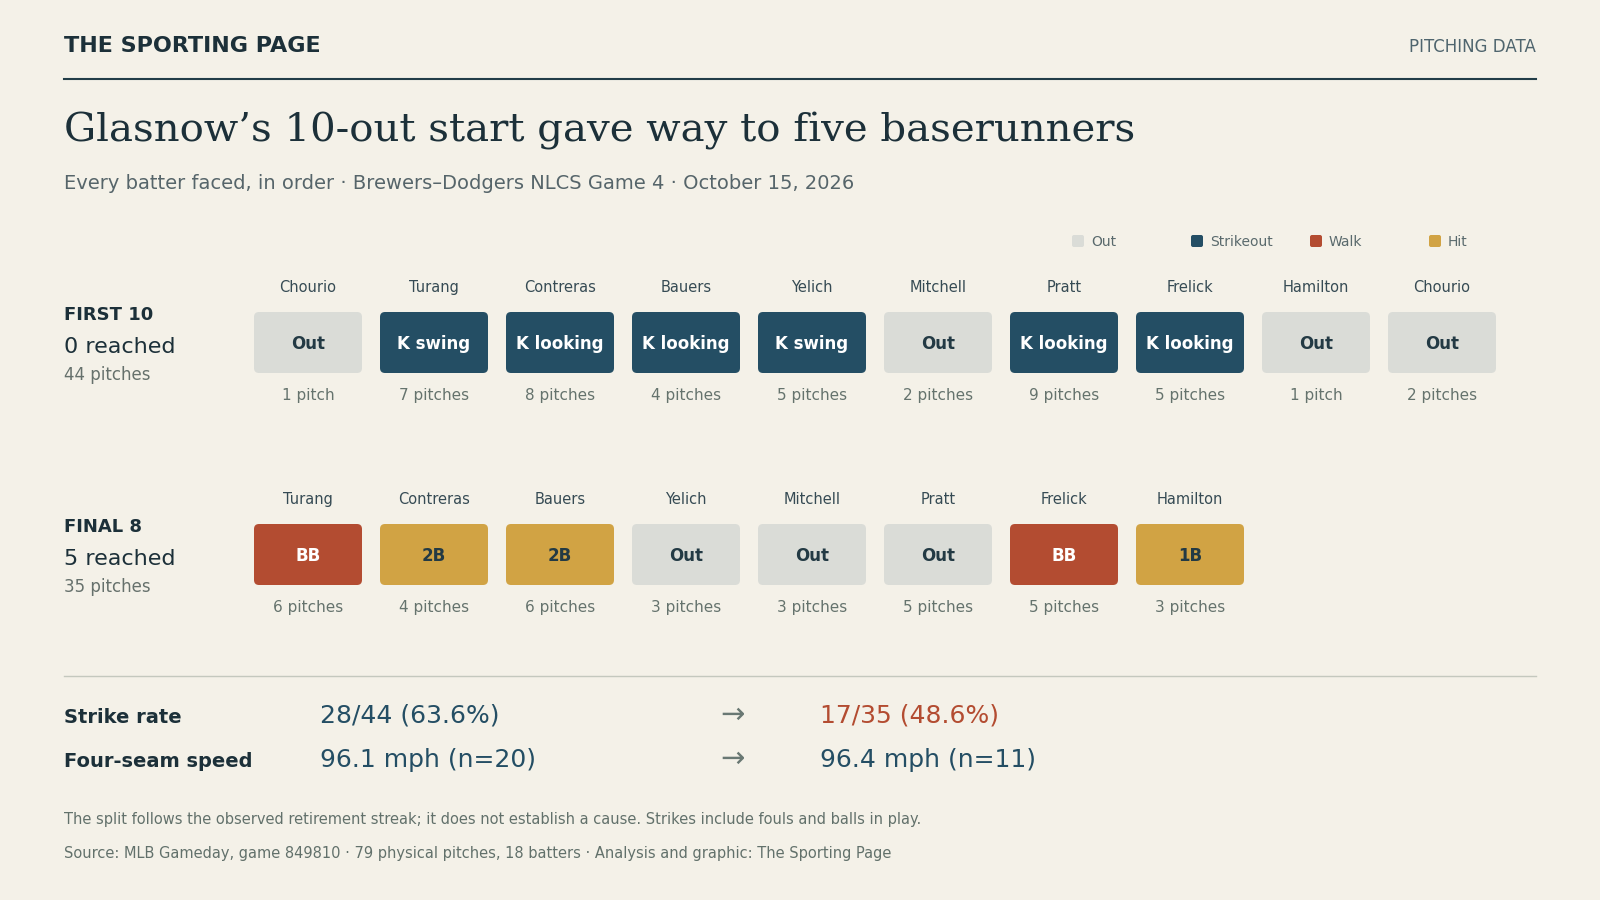
Tyler Glasnow retired the first 10 Brewers he faced in NLCS Game 4, six by strikeout. Over his final eight plate appearances, Milwaukee reached five times. Two walks preceded the hits that brought the Brewers back into a game Los Angeles had led 4-0.
The split was pronounced, but the shortage of swings and misses ran through the entire start. Glasnow generated three misses during those first 10 plate appearances and two thereafter. Called strikes helped him complete the early strikeouts. Later, a walk followed by consecutive doubles produced two runs in the fourth, and another walk preceded an RBI single in the fifth. He left after 79 pitches with one out and a runner aboard.
One outing in two phases
Every batter faced, in order. Select any outcome to inspect the plate appearance.
| Measure | First 10 hitters | Final 8 hitters |
|---|---|---|
| Strikes / pitches | 28 / 44 (63.6%) | 17 / 35 (48.6%) |
| Misses / swings | 3 / 17 (17.6%) | 2 / 13 (15.4%) |
| Four-seam speed | 96.1 mph (n=20) | 96.4 mph (n=11) |
| Sinker speed | 96.4 mph (n=11) | 96.5 mph (n=11) |
The boundary follows the observed 10-out streak. It is descriptive, rather than a first or second trip through the lineup. Strikes include fouls and balls in play; misses exclude foul tips. View the shareable graphic.
Six strikeouts with five missed swings
Four of Glasnow’s six strikeouts ended with the hitter taking strike three. William Contreras was called out on the eighth pitch of his first-inning plate appearance. In the third, Cooper Pratt fouled off four consecutive pitches before taking a sinker for strike three. Sal Frelick also went down looking at a sinker. All six strikeouts came in the first three innings.
Those were productive finishes, including outs after Milwaukee extended at-bats. Across the outing, however, the Brewers missed just five of 30 swings, a 16.7% miss rate. Glasnow’s 13 regular-season starts produced 149 misses on 486 swings, or 30.7%, using the same definition, which excludes foul tips.
The contrast helps explain why the six strikeouts need to be read alongside the rest of the pitch record. Glasnow threw 28 of 44 pitches for strikes against his first 10 hitters, or 63.6%. That fell to 17 of 35, or 48.6%, over his final eight, a stretch containing both walks. Called strikes had helped finish early at-bats; the later balls gave Milwaukee additional baserunners.
The fourth turned on a walk and two doubles
Jackson Chourio’s foul popup opened the fourth and completed the run of 10 outs. Brice Turang then walked on six pitches. Glasnow reached a full count with a fastball swing and miss, but his next fastball missed low. It was Milwaukee’s first baserunner.
Contreras drove a 96.0 mph four-seamer for a ground-rule double to left, hit at 108.4 mph. Jake Bauers followed with another ground-rule double, this one to right at 109.2 mph, scoring both runners. The two line drives turned the walk into the first run and immediately supplied a second.
Bauers’ plate appearance is the useful sequence to examine closely. Glasnow opened with a called knuckle curve, then reached 2-2 through a fastball ball, a knuckle-curve ball and a knuckle-curve foul. A sinker missed to fill the count. The sixth pitch, an 81.9 mph knuckle curve tracked near the middle of the zone, became the two-run double. Glasnow retired Christian Yelich and Garrett Mitchell on grounders to preserve a 4-2 lead.
Frelick’s walk carried into the bullpen
After Pratt’s flyout began the fifth, Frelick walked on five pitches. All four balls were fastballs. Frelick stole second during David Hamilton’s plate appearance, and Hamilton grounded a 1-1 slider through the middle to score him. The walk had become a run without requiring extra-base contact.
Glasnow departed with Hamilton on first and the Dodgers ahead 4-3. Evan Phillips recorded an out, then intentionally walked Turang after throwing three balls and walked Contreras to load the bases. Alex Vesia’s four-pitch walk to Bauers forced Hamilton home.
That inherited run completed Glasnow’s official line: four earned runs in 4⅓ innings, with three hits, two walks and six strikeouts. Three runs scored while he pitched. The fourth required the bullpen’s subsequent walks, which makes Hamilton’s path home essential context for assessing the starter’s final line.
Follow the evidence
Inspect the pitches behind the finding
The sequence preserves every pitch in the selected plate appearance. Available footage shows the ending of the plate appearance.
Catcher view. Rectangle uses the first pitch’s recorded batter zone and a 17-inch plate width. Markers show sequence order, not ball size.
Pitch classifications and coordinates come from MLB’s recorded feed. A location alone does not establish the catcher’s target.
More fastballs, without more misses
Glasnow threw 31 four-seamers and 22 sinkers, together accounting for 67.1% of his pitches against 56.0% during the regular season. Slider use fell from 17.8% to 8.9%. His four-seamer averaged 96.2 mph, above his 95.5 mph season average, and the pitch generated three misses on 18 swings.
The fastball speed also held across the start. His four-seamer averaged 96.1 mph against the first 10 hitters and 96.4 mph against the final eight. The evidence supports a specific account of the breakdown: walks created baserunners, and Milwaukee’s hardest elevated contact arrived together in the fourth. It does not establish fatigue or explain the repertoire decisions.
Complete supporting record
The full pitch record and regular-season comparison support the analysis above. Expand either section to inspect the measurements.
Full repertoire comparison and workload
Regular-season comparison: 1,149 physical pitches in 13 MLB games, 2026-03-28 through 2026-09-24, restricted to game type R and covering all clubs for that pitcher.
| Pitch type | Game n | Game share | Season n | Season share | Change (pp) | Game mph | Season mph (n) | Game rpm | Season rpm (n) | Misses / swings |
|---|---|---|---|---|---|---|---|---|---|---|
| Four-Seam Fastball (FF) | 31 | 39.2% | 398 | 34.6% | +4.6 | 96.2 | 95.5 (398) | 2,479 | 2,520 (398) | 3 / 18 |
| Sinker (SI) | 22 | 27.8% | 245 | 21.3% | +6.5 | 96.4 | 95.8 (245) | 2,494 | 2,490 (245) | 1 / 5 |
| Knuckle Curve (KC) | 15 | 19.0% | 245 | 21.3% | -2.3 | 81.3 | 80.7 (245) | 2,824 | 2,823 (245) | 1 / 4 |
| Slider (SL) | 7 | 8.9% | 204 | 17.8% | -8.9 | 91.5 | 89.9 (204) | 2,600 | 2,637 (204) | 0 / 3 |
| Curveball (CU) | 4 | 5.1% | 57 | 5.0% | +0.1 | 86.1 | 83.8 (57) | 2,832 | 2,867 (57) | 0 / 0 |
| Inning | Pitches | Cumulative | Strikes | Misses | Outs | FF mph | Speed n |
|---|---|---|---|---|---|---|---|
| 1 | 16 | 16 | 10 | 1 | 3 | 96.4 | 6 |
| 2 | 11 | 27 | 7 | 2 | 3 | 95.8 | 5 |
| 3 | 15 | 42 | 10 | 0 | 3 | 96.0 | 9 |
| 4 | 24 | 66 | 12 | 2 | 3 | 96.4 | 9 |
| 5 | 13 | 79 | 6 | 0 | 1 | 96.4 | 2 |
Fastball comparison uses the outing’s most-used fastball classification in every inning. Small inning samples are labeled and do not establish fatigue or explain a pitching change.
Complete pitch record · 79 of 79 pitches
Filter the record, then select a pitch for its tracking measurements. Completed plate-appearance outcomes remain separate from individual pitch results.
| Pitch | Inn. | Hitter | Count | Type | mph | rpm | Pitch result | PA outcome |
|---|---|---|---|---|---|---|---|---|
| 1 | Jackson Chourio | 0–0 | SI | 96.3 | 2341 | In play, out(s) | Groundout | |
| 1 | Brice Turang | 0–0 | FF | 95.8 | 2635 | Ball | Strikeout | |
| 1 | Brice Turang | 1–0 | FF | 96.2 | 2639 | Called Strike | Strikeout | |
| 1 | Brice Turang | 1–1 | KC | 80.4 | 2697 | Called Strike | Strikeout | |
| 1 | Brice Turang | 1–2 | CU | 87.3 | 2680 | Ball | Strikeout | |
| 1 | Brice Turang | 2–2 | SI | 97.2 | 2504 | Ball | Strikeout | |
| 1 | Brice Turang | 3–2 | FF | 97.0 | 2495 | Foul | Strikeout | |
| 1 | Brice Turang | 3–2 | FF | 95.8 | 2339 | Swinging Strike | Strikeout | |
| 1 | William Contreras | 0–0 | SI | 94.8 | 2488 | Called Strike | Strikeout | |
| 1 | William Contreras | 0–1 | SI | 96.7 | 2506 | Foul | Strikeout | |
| 1 | William Contreras | 0–2 | CU | 87.3 | 2840 | Ball | Strikeout | |
| 1 | William Contreras | 1–2 | CU | 83.5 | 2865 | Ball | Strikeout | |
| 1 | William Contreras | 2–2 | FF | 96.5 | 2552 | Foul | Strikeout | |
| 1 | William Contreras | 2–2 | SL | 91.2 | 2495 | Ball | Strikeout | |
| 1 | William Contreras | 3–2 | FF | 96.9 | 2360 | Foul | Strikeout | |
| 1 | William Contreras | 3–2 | KC | 80.7 | 2720 | Called Strike | Strikeout | |
| 2 | Jake Bauers | 0–0 | FF | 96.0 | 2689 | Swinging Strike | Strikeout | |
| 2 | Jake Bauers | 0–1 | KC | 80.9 | 2825 | Called Strike | Strikeout | |
| 2 | Jake Bauers | 0–2 | CU | 86.3 | 2942 | Ball | Strikeout | |
| 2 | Jake Bauers | 1–2 | KC | 81.1 | 2964 | Called Strike | Strikeout | |
| 2 | Christian Yelich | 0–0 | FF | 96.5 | 2447 | Ball | Strikeout | |
| 2 | Christian Yelich | 1–0 | FF | 93.7 | 2499 | Ball | Strikeout | |
| 2 | Christian Yelich | 2–0 | FF | 96.3 | 2409 | Foul | Strikeout | |
| 2 | Christian Yelich | 2–1 | SI | 96.9 | 2467 | Called Strike | Strikeout | |
| 2 | Christian Yelich | 2–2 | KC | 82.4 | 2823 | Swinging Strike (Blocked) | Strikeout | |
| 2 | Garrett Mitchell | 0–0 | SI | 97.5 | 2526 | Ball | Groundout | |
| 2 | Garrett Mitchell | 1–0 | FF | 96.7 | 2452 | In play, out(s) | Groundout | |
| 3 | Cooper Pratt | 0–0 | FF | 96.8 | 2573 | Ball | Strikeout | |
| 3 | Cooper Pratt | 1–0 | FF | 96.3 | 2510 | Ball | Strikeout | |
| 3 | Cooper Pratt | 2–0 | FF | 96.4 | 2545 | Called Strike | Strikeout | |
| 3 | Cooper Pratt | 2–1 | SI | 96.4 | 2641 | Ball | Strikeout | |
| 3 | Cooper Pratt | 3–1 | FF | 96.0 | 2571 | Foul | Strikeout | |
| 3 | Cooper Pratt | 3–2 | FF | 95.8 | 2469 | Foul | Strikeout | |
| 3 | Cooper Pratt | 3–2 | FF | 95.6 | 2472 | Foul | Strikeout | |
| 3 | Cooper Pratt | 3–2 | FF | 96.5 | 2558 | Foul | Strikeout | |
| 3 | Cooper Pratt | 3–2 | SI | 96.3 | 2357 | Called Strike | Strikeout | |
| 3 | Sal Frelick | 0–0 | SI | 95.4 | 2465 | Called Strike | Strikeout | |
| 3 | Sal Frelick | 0–1 | KC | 81.8 | 2736 | Ball | Strikeout | |
| 3 | Sal Frelick | 1–1 | KC | 81.5 | 2719 | Ball | Strikeout | |
| 3 | Sal Frelick | 2–1 | FF | 94.8 | 2232 | Foul | Strikeout | |
| 3 | Sal Frelick | 2–2 | SI | 97.1 | 2551 | Called Strike | Strikeout | |
| 3 | David Hamilton | 0–0 | FF | 95.5 | 2357 | In play, out(s) | Bunt Groundout | |
| 4 | Jackson Chourio | 0–0 | SL | 91.4 | 2589 | Ball | Pop Out | |
| 4 | Jackson Chourio | 1–0 | SI | 95.5 | 2470 | In play, out(s) | Pop Out | |
| 4 | Brice Turang | 0–0 | SI | 96.3 | 2500 | Ball | Walk | |
| 4 | Brice Turang | 1–0 | FF | 96.6 | 2573 | Called Strike | Walk | |
| 4 | Brice Turang | 1–1 | SI | 97.2 | 2590 | Ball | Walk | |
| 4 | Brice Turang | 2–1 | SI | 97.6 | 2595 | Ball | Walk | |
| 4 | Brice Turang | 3–1 | FF | 95.8 | 2441 | Swinging Strike | Walk | |
| 4 | Brice Turang | 3–2 | FF | 97.4 | 2468 | Ball | Walk | |
| 4 | William Contreras | 0–0 | SL | 91.7 | 2688 | Ball | Double | |
| 4 | William Contreras | 1–0 | FF | 95.5 | 2443 | Foul | Double | |
| 4 | William Contreras | 1–1 | FF | 95.7 | 2286 | Ball | Double | |
| 4 | William Contreras | 2–1 | FF | 96.0 | 2462 | In play, no out | Double | |
| 4 | Jake Bauers | 0–0 | KC | 80.6 | 2750 | Called Strike | Double | |
| 4 | Jake Bauers | 0–1 | FF | 97.5 | 2342 | Ball | Double | |
| 4 | Jake Bauers | 1–1 | KC | 81.6 | 2922 | Ball | Double | |
| 4 | Jake Bauers | 2–1 | KC | 81.4 | 2820 | Foul | Double | |
| 4 | Jake Bauers | 2–2 | SI | 97.2 | 2507 | Ball | Double | |
| 4 | Jake Bauers | 3–2 | KC | 81.9 | 2900 | In play, run(s) | Double | |
| 4 | Christian Yelich | 0–0 | SL | 92.5 | 2577 | Ball | Groundout | |
| 4 | Christian Yelich | 1–0 | SL | 91.7 | 2611 | Foul | Groundout | |
| 4 | Christian Yelich | 1–1 | FF | 97.2 | 2461 | In play, out(s) | Groundout | |
| 4 | Garrett Mitchell | 0–0 | SI | 96.8 | 2406 | Swinging Strike | Groundout | |
| 4 | Garrett Mitchell | 0–1 | FF | 96.1 | 2538 | Ball | Groundout | |
| 4 | Garrett Mitchell | 1–1 | KC | 82.2 | 2927 | In play, out(s) | Groundout | |
| 5 | Cooper Pratt | 0–0 | KC | 81.4 | 2918 | Ball | Flyout | |
| 5 | Cooper Pratt | 1–0 | SI | 95.7 | 2476 | Ball | Flyout | |
| 5 | Cooper Pratt | 2–0 | SI | 95.7 | 2470 | Called Strike | Flyout | |
| 5 | Cooper Pratt | 2–1 | SI | 96.2 | 2446 | Foul | Flyout | |
| 5 | Cooper Pratt | 2–2 | SL | 91.0 | 2491 | In play, out(s) | Flyout | |
| 5 | Sal Frelick | 0–0 | FF | 96.6 | 2488 | Ball | Walk | |
| 5 | Sal Frelick | 1–0 | SI | 96.3 | 2583 | Ball | Walk | |
| 5 | Sal Frelick | 2–0 | FF | 96.3 | 2529 | Foul | Walk | |
| 5 | Sal Frelick | 2–1 | SI | 95.7 | 2465 | Ball | Walk | |
| 5 | Sal Frelick | 3–1 | SI | 96.4 | 2515 | Ball | Walk | |
| 5 | David Hamilton | 0–0 | KC | 79.9 | 2789 | Called Strike | Single | |
| 5 | David Hamilton | 0–1 | KC | 81.2 | 2853 | Ball | Single | |
| 5 | David Hamilton | 1–1 | SL | 91.3 | 2752 | In play, run(s) | Single |
Sources and pitch definitions
Game record: MLB Gameday and its final pitch feed. Season comparison: MLB Baseball Savant, 2026 MLB regular season only. Original footage and captions: MLB Film Room. MLB can later correct scoring or pitch classifications.
Pitch counts include only physically thrown pitches. Strikes follow the official pitch-count convention, including fouls and balls in play. Misses mean swinging strikes, blocked swinging strikes and missed bunts; foul tips count as contact. Whiff rate is misses divided by swings. Called strikes plus misses are divided by all physical pitches.
Tracking measurements retain MLB’s supplied release speeds, spin, plate coordinates and pitch classifications, including separate CU and KC entries. Missing measurements are not estimated. Movement values preserve the feed’s sign convention; induced vertical break is not total drop. Pitch locations do not establish the catcher’s target or a pitcher’s intent. Innings use baseball notation: 4.1 means four innings and one out.