
MLB · Pitching Data
How two walks complicated Shane Drohan’s 25-pitch NLCS start
Drohan reached 0-2 against Shohei Ohtani and Mookie Betts, but needed a double play to escape the first. His harder, sinker-heavy repertoire produced one missed swing before he left a runner for Milwaukee's bullpen.
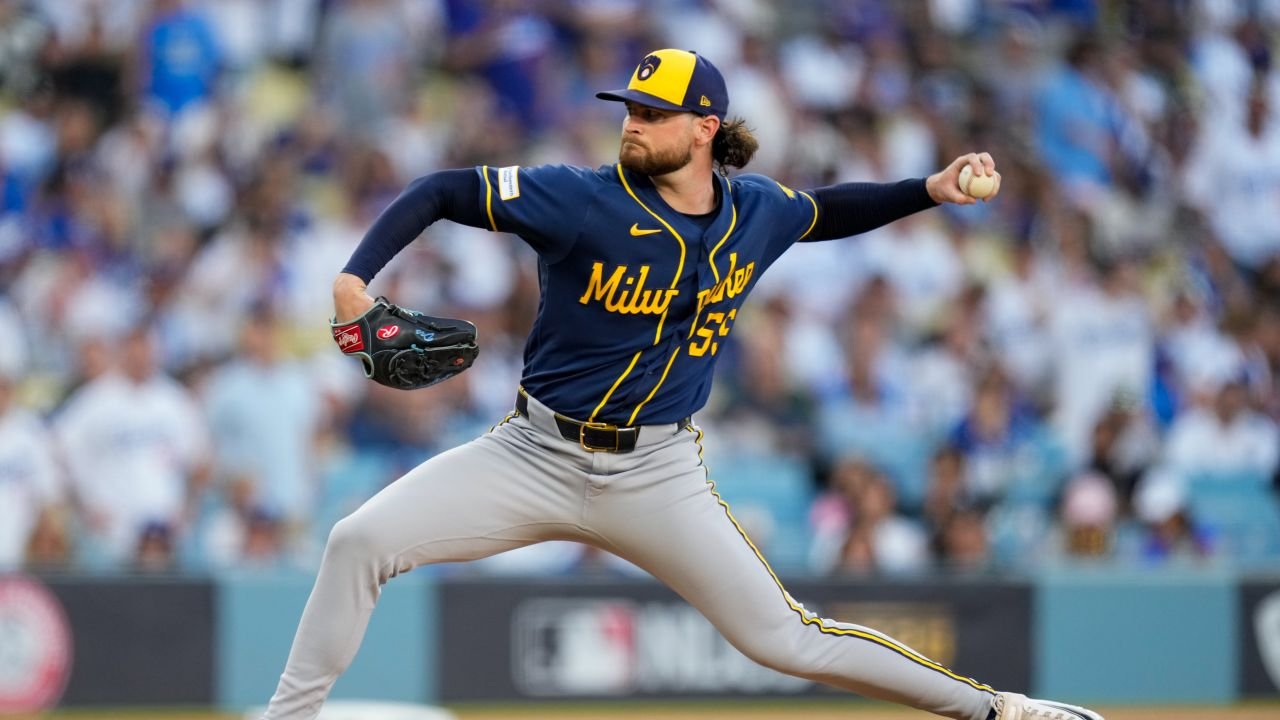
Milwaukee Brewers · Shane Drohan · NLCS Game 4
Strikes 12/25 · Misses 1/7 swings · Called strikes + misses 6/25
Early count advantages did not prevent the traffic
Shane Drohan's first inning in NLCS Game 4 ended without a run, but it required 22 pitches and an inning-ending double play. After getting ahead of the first two Dodgers 0-2, he struck out Shohei Ohtani and walked Mookie Betts. Freddie Freeman also walked before Will Smith's grounder gave Milwaukee its remaining two outs.
Drohan faced only five hitters in the Brewers' 6-4 win on October 15. His line contained one hit, two walks and one strikeout in one inning, with an earned run that scored after he departed. The pitch record shows how the first inning became demanding despite the favourable opening counts, and why the double play needs to be understood alongside the quality of the contact.
Every plate appearance, in order
Select an outcome to inspect its complete pitch sequence, locations and available official footage. Each row follows one pitcher’s chronological record.
Ohtani and Betts reached the same count, with different endings
Ohtani took sliders at 88.8 and 89.6 mph for called strikes. Drohan then missed with a 98.2 mph sinker, got a foul on another sinker and finished with a 91.4 mph slider below the zone. The fifth pitch produced his only swing and miss of the appearance.
Betts took a 97.5 mph sinker and an 83.6 mph curveball for strikes. From 0-2, he saw four balls and fouled off one sinker during a seven-pitch walk. The last two sinkers both registered 97.2 mph and crossed at nearly identical locations, off the same side of the plate and near the bottom of Betts' recorded strike zone. He took both.
Those two plate appearances illustrate the difference between obtaining an advantage and completing an out. Drohan secured four called strikes in his first seven pitches, but Betts' subsequent takes kept a runner aboard. Freeman's five-pitch walk then began with three consecutive balls, putting two runners on with one out.
Smith's double play was hard contact on the ground
Smith took two low curveballs, fouled a four-seamer and took another four-seamer high to reach 3-1. He grounded the next pitch, a 95.4 mph sinker, to Cooper Pratt. The shortstop started the double play, with Brice Turang relaying to Jake Bauers to end the inning.
Smith's ball left the bat at 96.8 mph, above the 95 mph hard-hit threshold, with a minus-19-degree launch angle. The downward trajectory and completed infield turn produced the escape. The result was valuable, but it does not support describing the contact as weak. Drohan had thrown 12 balls against 10 strikes in the inning, and two of his three outs came on that single swing.
Follow the evidence
Inspect the pitches behind the finding
Select a plate appearance, then an individual pitch. Numbers on the location plot follow that plate appearance’s pitch order.
Catcher view. The rectangle is 17 inches wide and uses the first pitch’s recorded batter-zone top and bottom. Markers describe recorded crossing points and are not drawn to ball size. The plot does not establish the catcher’s target.
Tucker became the inherited run
Kyle Tucker opened the second by fouling a sinker and taking a slider low. On the third pitch, he grounded a 95.7 mph sinker through the left side at 103.4 mph. Both balls put in play against Drohan were hard-hit grounders; one became a double play and the other a single.
Dustin May entered with Tucker on first and no outs. Teoscar Hernández singled Tucker to third, and Andy Pages later singled him home. Tucker was the one earned run charged to Drohan, although nobody scored while Drohan was on the mound. Ohtani's subsequent three-run homer accounted for the other runs in the inning, all charged to May.
A faster sinker occupied a much larger share
Drohan threw 14 sinkers among his 25 pitches, a 56.0% share, compared with 439 of 2,001 pitches, or 21.9%, during the regular season. The Game 4 sinkers averaged 96.8 mph against a 94.9 mph season average. Seven were balls, and the Dodgers made contact on all five swings against the pitch.
His overall miss rate was one in seven swings, or 14.3%, against 234 in 962, or 24.3%, during the regular season. Those comparisons describe a five-batter appearance against a baseline spanning 33 outings, including 19 starts. They do not establish a lasting repertoire change or explain the decision to replace him. The immediate issue was completing plate appearances: the early strikes were followed by walks, and the hard-hit double play kept those walks from becoming first-inning runs.
Complete supporting record
Every physical pitch is retained. Each season comparison uses that pitcher’s own 2026 MLB regular-season sample.
Shane Drohan · 25 pitches · season comparison and workload
Regular-season comparison: 2,001 physical pitches in 33 MLB games, 2026-04-08 through 2026-09-27, restricted to game type R and covering all clubs for that pitcher.
| Pitch type | Game n | Game share | Season n | Season share | Change (pp) | Game mph | Season mph (n) | Game rpm | Season rpm (n) | Misses / swings |
|---|---|---|---|---|---|---|---|---|---|---|
| Sinker (SI) | 14 | 56.0% | 439 | 21.9% | +34.1 | 96.8 | 94.9 (439) | 2,467 | 2,399 (428) | 0 / 5 |
| Slider (SL) | 5 | 20.0% | 433 | 21.6% | -1.6 | 89.7 | 86.5 (433) | 2,837 | 2,863 (427) | 1 / 1 |
| Four-Seam Fastball (FF) | 3 | 12.0% | 535 | 26.7% | -14.7 | 96.2 | 94.9 (535) | 2,532 | 2,443 (527) | 0 / 1 |
| Curveball (CU) | 3 | 12.0% | 259 | 12.9% | -0.9 | 83.8 | 80.7 (259) | 3,028 | 2,888 (254) | 0 / 0 |
| Changeup (CH) | 0 | 0.0% | 100 | 5.0% | -5.0 | n/a | 86.2 (100) | n/a | 1,634 (98) | 0 / 0 |
| Cutter (FC) | 0 | 0.0% | 235 | 11.7% | -11.7 | n/a | 90.9 (235) | n/a | 2,685 (225) | 0 / 0 |
| Inning | Pitches | Cumulative | Strikes | Misses | Outs | SI mph | Speed n |
|---|---|---|---|---|---|---|---|
| 1 | 22 | 22 | 10 | 1 | 3 | 97.1 | 12 |
| 2 | 3 | 25 | 2 | 0 | 0 | 95.2 | 2 |
Fastball comparison uses the outing’s most-used fastball classification in every inning. Small inning samples are labeled and do not establish fatigue or explain a pitching change.
First-pitch strikes: 3/5 plate appearances. Tracked contact: 2 measured exit speeds; 100.1 mph average; 2 at or above 95 mph. Contact totals include bunts. Individual game samples are small.
Complete pitch record · 25 of 25 pitches
Paper pitch numbers follow this combined chronological record. Each detail identifies the individual pitcher’s outing pitch number. A pitch result and the completed plate-appearance outcome remain separate fields.
| Pitch | Pitcher | Inn. | Hitter | Count | Type | mph | rpm | Pitch result | PA outcome |
|---|---|---|---|---|---|---|---|---|---|
| Shane Drohan | 1 | Shohei Ohtani | 0–0 | SL | 88.8 | 2,859 | Called Strike | Strikeout | |
| Shane Drohan | 1 | Shohei Ohtani | 0–1 | SL | 89.6 | 2,953 | Called Strike | Strikeout | |
| Shane Drohan | 1 | Shohei Ohtani | 0–2 | SI | 98.2 | 2,482 | Ball | Strikeout | |
| Shane Drohan | 1 | Shohei Ohtani | 1–2 | SI | 97.4 | 2,538 | Foul | Strikeout | |
| Shane Drohan | 1 | Shohei Ohtani | 1–2 | SL | 91.4 | 2,722 | Swinging Strike | Strikeout | |
| Shane Drohan | 1 | Mookie Betts | 0–0 | SI | 97.5 | 2,316 | Called Strike | Walk | |
| Shane Drohan | 1 | Mookie Betts | 0–1 | CU | 83.6 | 2,957 | Called Strike | Walk | |
| Shane Drohan | 1 | Mookie Betts | 0–2 | SI | 97.7 | 2,431 | Ball | Walk | |
| Shane Drohan | 1 | Mookie Betts | 1–2 | SL | 90.4 | 2,849 | Ball | Walk | |
| Shane Drohan | 1 | Mookie Betts | 2–2 | SI | 96.9 | 2,296 | Foul | Walk | |
| Shane Drohan | 1 | Mookie Betts | 2–2 | SI | 97.2 | 2,609 | Ball | Walk | |
| Shane Drohan | 1 | Mookie Betts | 3–2 | SI | 97.2 | 2,635 | Ball | Walk | |
| Shane Drohan | 1 | Freddie Freeman | 0–0 | SI | 97.3 | 2,520 | Ball | Walk | |
| Shane Drohan | 1 | Freddie Freeman | 1–0 | SI | 97.0 | 2,403 | Ball | Walk | |
| Shane Drohan | 1 | Freddie Freeman | 2–0 | FF | 97.0 | 2,598 | Ball | Walk | |
| Shane Drohan | 1 | Freddie Freeman | 3–0 | SI | 96.4 | 2,478 | Called Strike | Walk | |
| Shane Drohan | 1 | Freddie Freeman | 3–1 | SI | 97.2 | 2,585 | Ball | Walk | |
| Shane Drohan | 1 | Will Smith | 0–0 | CU | 84.3 | 3,068 | Ball | Grounded Into DP | |
| Shane Drohan | 1 | Will Smith | 1–0 | CU | 83.6 | 3,058 | Ball In Dirt | Grounded Into DP | |
| Shane Drohan | 1 | Will Smith | 2–0 | FF | 95.9 | 2,497 | Foul | Grounded Into DP | |
| Shane Drohan | 1 | Will Smith | 2–1 | FF | 95.7 | 2,500 | Ball | Grounded Into DP | |
| Shane Drohan | 1 | Will Smith | 3–1 | SI | 95.4 | 2,539 | In play, out(s) | Grounded Into DP | |
| Shane Drohan | 2 | Kyle Tucker | 0–0 | SI | 94.7 | 2,445 | Foul | Single | |
| Shane Drohan | 2 | Kyle Tucker | 0–1 | SL | 88.5 | 2,803 | Ball | Single | |
| Shane Drohan | 2 | Kyle Tucker | 1–1 | SI | 95.7 | 2,257 | In play, no out | Single |
Sources and pitch definitions
Game record: MLB Gameday and the final MLB pitch feed. Season comparisons: MLB Baseball Savant, 2026 MLB regular season only. Original footage: MLB Film Room. MLB can later correct scoring or pitch classifications.
Counts include physically thrown pitches. Automatic balls and other no-pitch events are excluded. Strikes follow the official pitch-count convention, including fouls and balls in play. Misses are swinging strikes, blocked swinging strikes and missed bunts; foul tips count as contact. Whiff rate is misses divided by swings. Called strikes plus misses are divided by physical pitches.
Tracking retains MLB’s recorded release speed, spin, plate coordinates and native pitch classifications. CU and KC remain separate. Missing measurements are not estimated. Movement values preserve the feed’s sign convention; induced vertical break is not total drop. Locations do not establish the catcher’s target. Hard hit means a recorded exit speed of at least 95 mph. Innings use baseball notation: 4.1 means four innings and one out.