
MLB · Pitching Data
How the Dodgers’ bullpen lost the lead on walks, then two home runs
Los Angeles threw two-thirds of its relief pitches for strikes in NLCS Game 4. That overall figure conceals the fifth-inning walks that tied the game, before Milwaukee's only two hits against the bullpen supplied the winning runs.
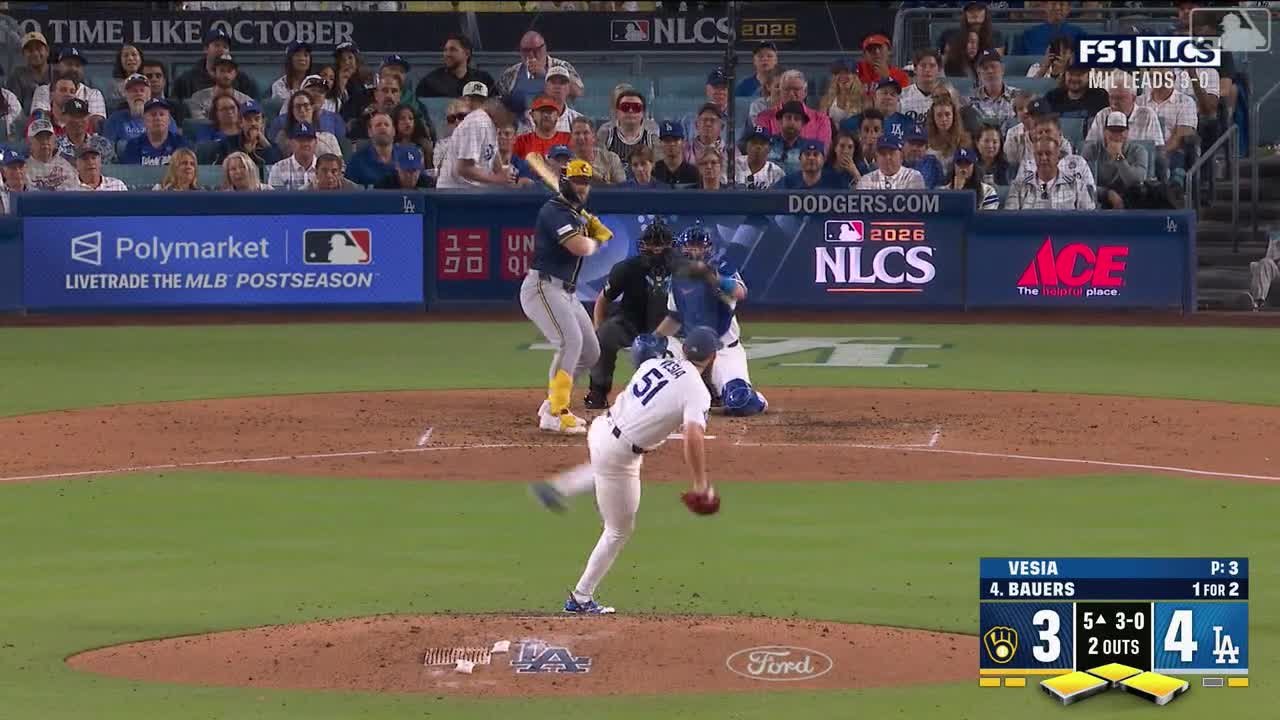
Los Angeles Dodgers · Combined bullpen paper · NLCS Game 4
Strikes 56/84 · Misses 10/43 swings · Called strikes + misses 23/84
The overall strike rate hides the fifth inning
The Dodgers' bullpen threw 56 of 84 pitches for strikes in NLCS Game 4, a 66.7% rate. Its work split into sharply different stretches. Evan Phillips and Alex Vesia combined for 10 strikes in 23 pitches while obtaining the last two outs of the fifth. Tanner Scott and Edwin Díaz followed with 46 strikes in 61 pitches over the final four innings.
Milwaukee tied the game during the first stretch without getting a hit against either reliever. The Brewers then managed only two hits against Scott and Díaz, but both were solo home runs. The sequence turned a 4-3 Dodgers lead when Tyler Glasnow departed into a 6-4 defeat on October 15, completing Milwaukee's NLCS sweep.
The combined relief line was 4⅔ innings, two hits, two earned runs, three walks and four strikeouts. Three runs actually crossed while the bullpen pitched. David Hamilton, who had singled against Glasnow, scored the tying run on Vesia's bases-loaded walk. His run remained charged to the starter. Reading the bullpen's two-run total alone misses its role in surrendering the lead.
Every plate appearance, in order
Select an outcome to inspect its complete pitch sequence, locations and available official footage. Each row follows one pitcher’s chronological record.
| Pitcher | IP | H | R / ER | BB | K | Pitches / strikes | Inherited / scored |
|---|---|---|---|---|---|---|---|
| Evan Phillips | 0.1 | 0 | 0 / 0 | 2 | 0 | 14 / 6 | 1 / 0 |
| Alex Vesia | 0.1 | 0 | 0 / 0 | 1 | 0 | 9 / 4 | 3 / 1 |
| Tanner Scott | 1.0 | 1 | 1 / 1 | 0 | 2 | 24 / 17 | 0 / 0 |
| Edwin Díaz | 3.0 | 1 | 1 / 1 | 0 | 2 | 37 / 29 | 0 / 0 |
R / ER means runs officially charged. Inherited runners remain charged to their previous pitcher. The same runner may be inherited at successive pitching changes, so inherited-runner entries must not be added as unique runners.
Phillips left Vesia no room for another walk
Phillips entered with Hamilton on first and one out. Jackson Chourio lined a 1-2 sweeper to centre at 109.8 mph, where Andy Pages caught it. Hamilton stole second during Brice Turang's next plate appearance. Phillips threw three balls before an intentional walk was awarded, with an automatic fourth ball completing the pass. Those were three physical pitches, rather than four.
William Contreras then walked on six pitches. Phillips began with a called sweeper, fell behind 3-1 and recovered with a 97.7 mph fastball swing and miss. His full-count sweeper bounced, loading the bases and ending his appearance. Phillips obtained one out on 14 pitches, with two walks and no hit allowed.
Eight of those 14 pitches were sweepers, a 57.1% share against 157 of 423 pitches, or 37.1%, during his regular season. Five of the eight were balls. The increased share describes the outing; the more immediate problem was where those pitches finished.
Bauers did not need to swing to tie it
Vesia inherited the loaded bases and threw four balls to Jake Bauers. Two four-seamers missed before a slider and another four-seamer completed the walk. The final fastball was tracked above the strike zone. Hamilton came home, and the score was 4-4. Christian Yelich subsequently grounded to Max Muncy, ending the inning with three Brewers stranded.
Vesia recorded one out in nine pitches, with one walk. Neither he nor Phillips was charged with a run. Their scoreless individual lines therefore need the inherited-run context: the bullpen entered with a one-run lead and finished the fifth tied.
Vesia's five four-seamers represented 55.6% of his outing, almost identical to his regular-season 55.8% share, or 564 of 1,011 pitches. They averaged 92.0 mph against 92.1 mph for the season. A broad change in fastball use or speed was not necessary for the four-pitch walk that tied the game.
Follow the evidence
Inspect the pitches behind the finding
Select a plate appearance, then an individual pitch. Numbers on the location plot follow that plate appearance’s pitch order.
Catcher view. The rectangle is 17 inches wide and uses the first pitch’s recorded batter-zone top and bottom. Markers describe recorded crossing points and are not drawn to ball size. The plot does not establish the catcher’s target.
Scott's 0-2 advantage became the go-ahead homer
Scott opened the sixth by getting Garrett Mitchell to 0-2 on sliders, one called and one missed. Two more sliders and a fastball missed the zone. Mitchell then drove a 97.4 mph four-seamer tracked near the middle of the zone to centre for a 409-foot home run, hit at 105.2 mph. Milwaukee led for good.
Scott retired the next three hitters, striking out Cooper Pratt and Hamilton around Sal Frelick's groundout. Those outs took another 18 pitches. His inning ended with one hit, one earned run and two strikeouts on 24 pitches, without a walk.
He used 15 sliders, a 62.5% share compared with 490 of 963 pitches, or 50.9%, in the regular season. Their 90.1 mph average exceeded his season's 89.3 mph. The slider drew two misses on eight swings. Mitchell's decisive plate appearance started with four sliders, then ended with consecutive fastballs after the count reached 2-2.
Díaz's slider supplied the misses and the insurance run
Díaz recorded nine outs on 37 pitches over the final three innings. He retired his first eight batters, keeping the deficit at one through the seventh and eighth and into the ninth. That stretch included Mitchell's 110.8 mph lineout to Pages in the eighth, a reminder that outs did not always mean weak contact.
His slider generated all six of his missed swings, on 12 swings, a 50.0% rate. Its regular-season comparison was 23 misses on 87 swings, or 26.4%. His four-seamer generated no misses on nine swings. Díaz threw 19 fastballs and 18 sliders, with both pitches averaging about 0.9 mph faster than their respective season averages.
With two outs in the ninth, Hamilton took a fastball for ball one and drove a 90.2 mph slider near the middle of the zone to right-centre for a 402-foot homer. Díaz struck out Chourio to finish with one earned run and two strikeouts. His slider's six misses and Hamilton's homer belong in the same assessment: the pitch created most of the bullpen's misses, but one of its four balls put in play became the final run.
Complete supporting record
Every physical pitch is retained. Each season comparison uses that pitcher’s own 2026 MLB regular-season sample.
Evan Phillips · 14 pitches · season comparison and workload
Regular-season comparison: 423 physical pitches in 31 MLB games, 2026-07-07 through 2026-09-27, restricted to game type R and covering all clubs for that pitcher.
| Pitch type | Game n | Game share | Season n | Season share | Change (pp) | Game mph | Season mph (n) | Game rpm | Season rpm (n) | Misses / swings |
|---|---|---|---|---|---|---|---|---|---|---|
| Sweeper (ST) | 8 | 57.1% | 157 | 37.1% | +20.0 | 87.5 | 86.2 (157) | 2,555 | 2,585 (157) | 0 / 2 |
| Four-Seam Fastball (FF) | 5 | 35.7% | 191 | 45.2% | -9.4 | 97.1 | 96.9 (191) | 2,383 | 2,437 (190) | 1 / 1 |
| Sinker (SI) | 1 | 7.1% | 32 | 7.6% | -0.4 | 97.2 | 96.6 (32) | 2,189 | 2,252 (32) | 0 / 1 |
| Cutter (FC) | 0 | 0.0% | 43 | 10.2% | -10.2 | n/a | 92.4 (43) | n/a | 2,473 (41) | 0 / 0 |
| Inning | Pitches | Cumulative | Strikes | Misses | Outs | FF mph | Speed n |
|---|---|---|---|---|---|---|---|
| 5 | 14 | 14 | 6 | 1 | 1 | 97.1 | 5 |
Fastball comparison uses the outing’s most-used fastball classification in every inning. Small inning samples are labeled and do not establish fatigue or explain a pitching change.
First-pitch strikes: 2/3 plate appearances. Tracked contact: 1 measured exit speeds; 109.8 mph average; 1 at or above 95 mph. Contact totals include bunts. Individual game samples are small.
Alex Vesia · 9 pitches · season comparison and workload
Regular-season comparison: 1,011 physical pitches in 72 MLB games, 2026-03-27 through 2026-09-27, restricted to game type R and covering all clubs for that pitcher.
| Pitch type | Game n | Game share | Season n | Season share | Change (pp) | Game mph | Season mph (n) | Game rpm | Season rpm (n) | Misses / swings |
|---|---|---|---|---|---|---|---|---|---|---|
| Four-Seam Fastball (FF) | 5 | 55.6% | 564 | 55.8% | -0.2 | 92.0 | 92.1 (564) | 2,539 | 2,512 (564) | 0 / 1 |
| Slider (SL) | 4 | 44.4% | 305 | 30.2% | +14.3 | 85.0 | 84.4 (305) | 2,359 | 2,378 (305) | 0 / 2 |
| Changeup (CH) | 0 | 0.0% | 142 | 14.0% | -14.0 | n/a | 82.8 (142) | n/a | 1,885 (142) | 0 / 0 |
| Inning | Pitches | Cumulative | Strikes | Misses | Outs | FF mph | Speed n |
|---|---|---|---|---|---|---|---|
| 5 | 9 | 9 | 4 | 0 | 1 | 92.0 | 5 |
Fastball comparison uses the outing’s most-used fastball classification in every inning. Small inning samples are labeled and do not establish fatigue or explain a pitching change.
First-pitch strikes: 1/2 plate appearances. Tracked contact: 1 measured exit speeds; 82.5 mph average; 0 at or above 95 mph. Contact totals include bunts. Individual game samples are small.
Tanner Scott · 24 pitches · season comparison and workload
Regular-season comparison: 963 physical pitches in 69 MLB games, 2026-03-26 through 2026-09-26, restricted to game type R and covering all clubs for that pitcher.
| Pitch type | Game n | Game share | Season n | Season share | Change (pp) | Game mph | Season mph (n) | Game rpm | Season rpm (n) | Misses / swings |
|---|---|---|---|---|---|---|---|---|---|---|
| Slider (SL) | 15 | 62.5% | 490 | 50.9% | +11.6 | 90.1 | 89.3 (490) | 2,654 | 2,649 (490) | 2 / 8 |
| Four-Seam Fastball (FF) | 9 | 37.5% | 473 | 49.1% | -11.6 | 97.3 | 96.9 (473) | 2,594 | 2,547 (473) | 1 / 7 |
| Inning | Pitches | Cumulative | Strikes | Misses | Outs | FF mph | Speed n |
|---|---|---|---|---|---|---|---|
| 6 | 24 | 24 | 17 | 3 | 3 | 97.3 | 9 |
Fastball comparison uses the outing’s most-used fastball classification in every inning. Small inning samples are labeled and do not establish fatigue or explain a pitching change.
First-pitch strikes: 3/4 plate appearances. Tracked contact: 2 measured exit speeds; 98.8 mph average; 1 at or above 95 mph. Contact totals include bunts. Individual game samples are small.
Edwin Díaz · 37 pitches · season comparison and workload
Regular-season comparison: 395 physical pitches in 21 MLB games, 2026-03-27 through 2026-09-27, restricted to game type R and covering all clubs for that pitcher.
| Pitch type | Game n | Game share | Season n | Season share | Change (pp) | Game mph | Season mph (n) | Game rpm | Season rpm (n) | Misses / swings |
|---|---|---|---|---|---|---|---|---|---|---|
| Four-Seam Fastball (FF) | 19 | 51.4% | 220 | 55.7% | -4.3 | 97.4 | 96.5 (220) | 2,334 | 2,332 (220) | 0 / 9 |
| Slider (SL) | 18 | 48.6% | 172 | 43.5% | +5.1 | 90.3 | 89.4 (172) | 2,279 | 2,296 (172) | 6 / 12 |
| Sinker (SI) | 0 | 0.0% | 3 | 0.8% | -0.8 | n/a | 98.1 (3) | n/a | 2,278 (3) | 0 / 0 |
| Inning | Pitches | Cumulative | Strikes | Misses | Outs | FF mph | Speed n |
|---|---|---|---|---|---|---|---|
| 7 | 12 | 12 | 11 | 3 | 3 | 98.0 | 4 |
| 8 | 10 | 22 | 8 | 1 | 3 | 97.1 | 6 |
| 9 | 15 | 37 | 10 | 2 | 3 | 97.4 | 9 |
Fastball comparison uses the outing’s most-used fastball classification in every inning. Small inning samples are labeled and do not establish fatigue or explain a pitching change.
First-pitch strikes: 6/10 plate appearances. Tracked contact: 8 measured exit speeds; 92.8 mph average; 4 at or above 95 mph. Contact totals include bunts. Individual game samples are small.
Complete pitch record · 84 of 84 pitches
Paper pitch numbers follow this combined chronological record. Each detail identifies the individual pitcher’s outing pitch number. A pitch result and the completed plate-appearance outcome remain separate fields.
| Pitch | Pitcher | Inn. | Hitter | Count | Type | mph | rpm | Pitch result | PA outcome |
|---|---|---|---|---|---|---|---|---|---|
| Evan Phillips | 5 | Jackson Chourio | 0–0 | FF | 95.3 | 2,463 | Called Strike | Lineout | |
| Evan Phillips | 5 | Jackson Chourio | 0–1 | ST | 86.2 | 2,444 | Foul Tip | Lineout | |
| Evan Phillips | 5 | Jackson Chourio | 0–2 | ST | 89.0 | 2,552 | Ball In Dirt | Lineout | |
| Evan Phillips | 5 | Jackson Chourio | 1–2 | SI | 97.2 | 2,189 | Foul | Lineout | |
| Evan Phillips | 5 | Jackson Chourio | 1–2 | ST | 87.4 | 2,392 | In play, out(s) | Lineout | |
| Evan Phillips | 5 | Brice Turang | 0–0 | FF | 97.5 | 2,311 | Ball | Intent Walk | |
| Evan Phillips | 5 | Brice Turang | 1–0 | FF | 96.5 | 2,259 | Ball | Intent Walk | |
| Evan Phillips | 5 | Brice Turang | 2–0 | ST | 87.3 | 2,463 | Ball | Intent Walk | |
| Evan Phillips | 5 | William Contreras | 0–0 | ST | 88.2 | 2,567 | Called Strike | Walk | |
| Evan Phillips | 5 | William Contreras | 0–1 | ST | 86.2 | 2,609 | Ball | Walk | |
| Evan Phillips | 5 | William Contreras | 1–1 | ST | 87.3 | 2,547 | Ball | Walk | |
| Evan Phillips | 5 | William Contreras | 2–1 | FF | 98.5 | 2,460 | Ball | Walk | |
| Evan Phillips | 5 | William Contreras | 3–1 | FF | 97.7 | 2,422 | Swinging Strike | Walk | |
| Evan Phillips | 5 | William Contreras | 3–2 | ST | 88.3 | 2,864 | Ball In Dirt | Walk | |
| Alex Vesia | 5 | Jake Bauers | 0–0 | FF | 91.7 | 2,583 | Ball | Walk | |
| Alex Vesia | 5 | Jake Bauers | 1–0 | FF | 91.8 | 2,556 | Ball | Walk | |
| Alex Vesia | 5 | Jake Bauers | 2–0 | SL | 84.7 | 2,286 | Ball | Walk | |
| Alex Vesia | 5 | Jake Bauers | 3–0 | FF | 91.4 | 2,501 | Ball | Walk | |
| Alex Vesia | 5 | Christian Yelich | 0–0 | SL | 84.6 | 2,318 | Called Strike | Groundout | |
| Alex Vesia | 5 | Christian Yelich | 0–1 | FF | 92.7 | 2,573 | Foul | Groundout | |
| Alex Vesia | 5 | Christian Yelich | 0–2 | SL | 85.5 | 2,423 | Foul | Groundout | |
| Alex Vesia | 5 | Christian Yelich | 0–2 | FF | 92.5 | 2,480 | Ball | Groundout | |
| Alex Vesia | 5 | Christian Yelich | 1–2 | SL | 85.0 | 2,410 | In play, out(s) | Groundout | |
| Tanner Scott | 6 | Garrett Mitchell | 0–0 | SL | 91.2 | 2,543 | Called Strike | Home Run | |
| Tanner Scott | 6 | Garrett Mitchell | 0–1 | SL | 90.6 | 2,610 | Swinging Strike | Home Run | |
| Tanner Scott | 6 | Garrett Mitchell | 0–2 | SL | 89.3 | 2,581 | Ball | Home Run | |
| Tanner Scott | 6 | Garrett Mitchell | 1–2 | SL | 92.1 | 2,742 | Ball | Home Run | |
| Tanner Scott | 6 | Garrett Mitchell | 2–2 | FF | 97.3 | 2,547 | Ball | Home Run | |
| Tanner Scott | 6 | Garrett Mitchell | 3–2 | FF | 97.4 | 2,629 | In play, run(s) | Home Run | |
| Tanner Scott | 6 | Cooper Pratt | 0–0 | SL | 91.3 | 2,670 | Foul | Strikeout | |
| Tanner Scott | 6 | Cooper Pratt | 0–1 | FF | 96.8 | 2,521 | Ball | Strikeout | |
| Tanner Scott | 6 | Cooper Pratt | 1–1 | FF | 96.7 | 2,603 | Foul | Strikeout | |
| Tanner Scott | 6 | Cooper Pratt | 1–2 | SL | 90.4 | 2,657 | Foul | Strikeout | |
| Tanner Scott | 6 | Cooper Pratt | 1–2 | FF | 97.7 | 2,477 | Foul | Strikeout | |
| Tanner Scott | 6 | Cooper Pratt | 1–2 | FF | 97.6 | 2,645 | Foul | Strikeout | |
| Tanner Scott | 6 | Cooper Pratt | 1–2 | SL | 89.6 | 2,755 | Ball | Strikeout | |
| Tanner Scott | 6 | Cooper Pratt | 2–2 | SL | 90.1 | 2,646 | Foul Tip | Strikeout | |
| Tanner Scott | 6 | Sal Frelick | 0–0 | SL | 90.9 | 2,686 | Ball | Groundout | |
| Tanner Scott | 6 | Sal Frelick | 1–0 | FF | 97.8 | 2,700 | Foul | Groundout | |
| Tanner Scott | 6 | Sal Frelick | 1–1 | SL | 90.0 | 2,611 | Ball | Groundout | |
| Tanner Scott | 6 | Sal Frelick | 2–1 | SL | 88.1 | 2,702 | Called Strike | Groundout | |
| Tanner Scott | 6 | Sal Frelick | 2–2 | FF | 96.4 | 2,610 | Foul | Groundout | |
| Tanner Scott | 6 | Sal Frelick | 2–2 | SL | 87.9 | 2,590 | Foul | Groundout | |
| Tanner Scott | 6 | Sal Frelick | 2–2 | SL | 89.3 | 2,693 | In play, out(s) | Groundout | |
| Tanner Scott | 6 | David Hamilton | 0–0 | SL | 90.4 | 2,670 | Foul | Strikeout | |
| Tanner Scott | 6 | David Hamilton | 0–1 | SL | 90.9 | 2,659 | Swinging Strike | Strikeout | |
| Tanner Scott | 6 | David Hamilton | 0–2 | FF | 97.7 | 2,613 | Swinging Strike | Strikeout | |
| Edwin Díaz | 7 | Jackson Chourio | 0–0 | SL | 89.6 | 2,301 | Foul | Lineout | |
| Edwin Díaz | 7 | Jackson Chourio | 0–1 | SL | 88.4 | 2,226 | Swinging Strike | Lineout | |
| Edwin Díaz | 7 | Jackson Chourio | 0–2 | SL | 90.2 | 2,257 | In play, out(s) | Lineout | |
| Edwin Díaz | 7 | Brice Turang | 0–0 | FF | 97.4 | 2,133 | Foul | Flyout | |
| Edwin Díaz | 7 | Brice Turang | 0–1 | FF | 97.9 | 2,364 | Foul | Flyout | |
| Edwin Díaz | 7 | Brice Turang | 0–2 | SL | 90.1 | 2,297 | Foul | Flyout | |
| Edwin Díaz | 7 | Brice Turang | 0–2 | FF | 98.5 | 2,261 | In play, out(s) | Flyout | |
| Edwin Díaz | 7 | William Contreras | 0–0 | SL | 91.0 | 2,208 | Ball | Groundout | |
| Edwin Díaz | 7 | William Contreras | 1–0 | SL | 90.0 | 2,242 | Swinging Strike | Groundout | |
| Edwin Díaz | 7 | William Contreras | 1–1 | SL | 89.4 | 2,239 | Swinging Strike | Groundout | |
| Edwin Díaz | 7 | William Contreras | 1–2 | FF | 98.2 | 2,282 | Foul | Groundout | |
| Edwin Díaz | 7 | William Contreras | 1–2 | SL | 90.3 | 2,232 | In play, out(s) | Groundout | |
| Edwin Díaz | 8 | Jake Bauers | 0–0 | FF | 97.3 | 2,493 | Ball | Flyout | |
| Edwin Díaz | 8 | Jake Bauers | 1–0 | FF | 97.4 | 2,600 | Called Strike | Flyout | |
| Edwin Díaz | 8 | Jake Bauers | 1–1 | FF | 97.0 | 2,514 | Called Strike | Flyout | |
| Edwin Díaz | 8 | Jake Bauers | 1–2 | FF | 97.1 | 2,429 | Ball | Flyout | |
| Edwin Díaz | 8 | Jake Bauers | 2–2 | FF | 97.2 | 2,488 | In play, out(s) | Flyout | |
| Edwin Díaz | 8 | Christian Yelich | 0–0 | SL | 90.0 | 2,330 | Called Strike | Strikeout | |
| Edwin Díaz | 8 | Christian Yelich | 0–1 | SL | 90.6 | 2,392 | Called Strike | Strikeout | |
| Edwin Díaz | 8 | Christian Yelich | 0–2 | SL | 90.0 | 2,373 | Swinging Strike | Strikeout | |
| Edwin Díaz | 8 | Garrett Mitchell | 0–0 | FF | 96.4 | 2,285 | Called Strike | Lineout | |
| Edwin Díaz | 8 | Garrett Mitchell | 0–1 | SL | 90.9 | 2,372 | In play, out(s) | Lineout | |
| Edwin Díaz | 9 | Cooper Pratt | 0–0 | SL | 90.0 | 2,359 | Called Strike | Groundout | |
| Edwin Díaz | 9 | Cooper Pratt | 0–1 | FF | 97.4 | 2,261 | In play, out(s) | Groundout | |
| Edwin Díaz | 9 | Sal Frelick | 0–0 | FF | 96.1 | 2,301 | Called Strike | Groundout | |
| Edwin Díaz | 9 | Sal Frelick | 0–1 | FF | 97.3 | 2,273 | Foul | Groundout | |
| Edwin Díaz | 9 | Sal Frelick | 0–2 | FF | 98.0 | 2,334 | Foul | Groundout | |
| Edwin Díaz | 9 | Sal Frelick | 0–2 | SL | 90.9 | 2,298 | Ball | Groundout | |
| Edwin Díaz | 9 | Sal Frelick | 1–2 | FF | 98.5 | 2,280 | Ball | Groundout | |
| Edwin Díaz | 9 | Sal Frelick | 2–2 | FF | 97.8 | 2,318 | In play, out(s) | Groundout | |
| Edwin Díaz | 9 | David Hamilton | 0–0 | FF | 97.0 | 2,117 | Ball | Home Run | |
| Edwin Díaz | 9 | David Hamilton | 1–0 | SL | 90.2 | 2,169 | In play, run(s) | Home Run | |
| Edwin Díaz | 9 | Jackson Chourio | 0–0 | SL | 90.3 | 2,245 | Ball | Strikeout | |
| Edwin Díaz | 9 | Jackson Chourio | 1–0 | FF | 98.5 | 2,365 | Ball | Strikeout | |
| Edwin Díaz | 9 | Jackson Chourio | 2–0 | FF | 96.0 | 2,245 | Called Strike | Strikeout | |
| Edwin Díaz | 9 | Jackson Chourio | 2–1 | SL | 91.5 | 2,314 | Swinging Strike | Strikeout | |
| Edwin Díaz | 9 | Jackson Chourio | 2–2 | SL | 91.4 | 2,166 | Swinging Strike | Strikeout |
Sources and pitch definitions
Game record: MLB Gameday and the final MLB pitch feed. Season comparisons: MLB Baseball Savant, 2026 MLB regular season only. Original footage: MLB Film Room. MLB can later correct scoring or pitch classifications.
Counts include physically thrown pitches. Automatic balls and other no-pitch events are excluded. Strikes follow the official pitch-count convention, including fouls and balls in play. Misses are swinging strikes, blocked swinging strikes and missed bunts; foul tips count as contact. Whiff rate is misses divided by swings. Called strikes plus misses are divided by physical pitches.
Tracking retains MLB’s recorded release speed, spin, plate coordinates and native pitch classifications. CU and KC remain separate. Missing measurements are not estimated. Movement values preserve the feed’s sign convention; induced vertical break is not total drop. Locations do not establish the catcher’s target. Hard hit means a recorded exit speed of at least 95 mph. Innings use baseball notation: 4.1 means four innings and one out.