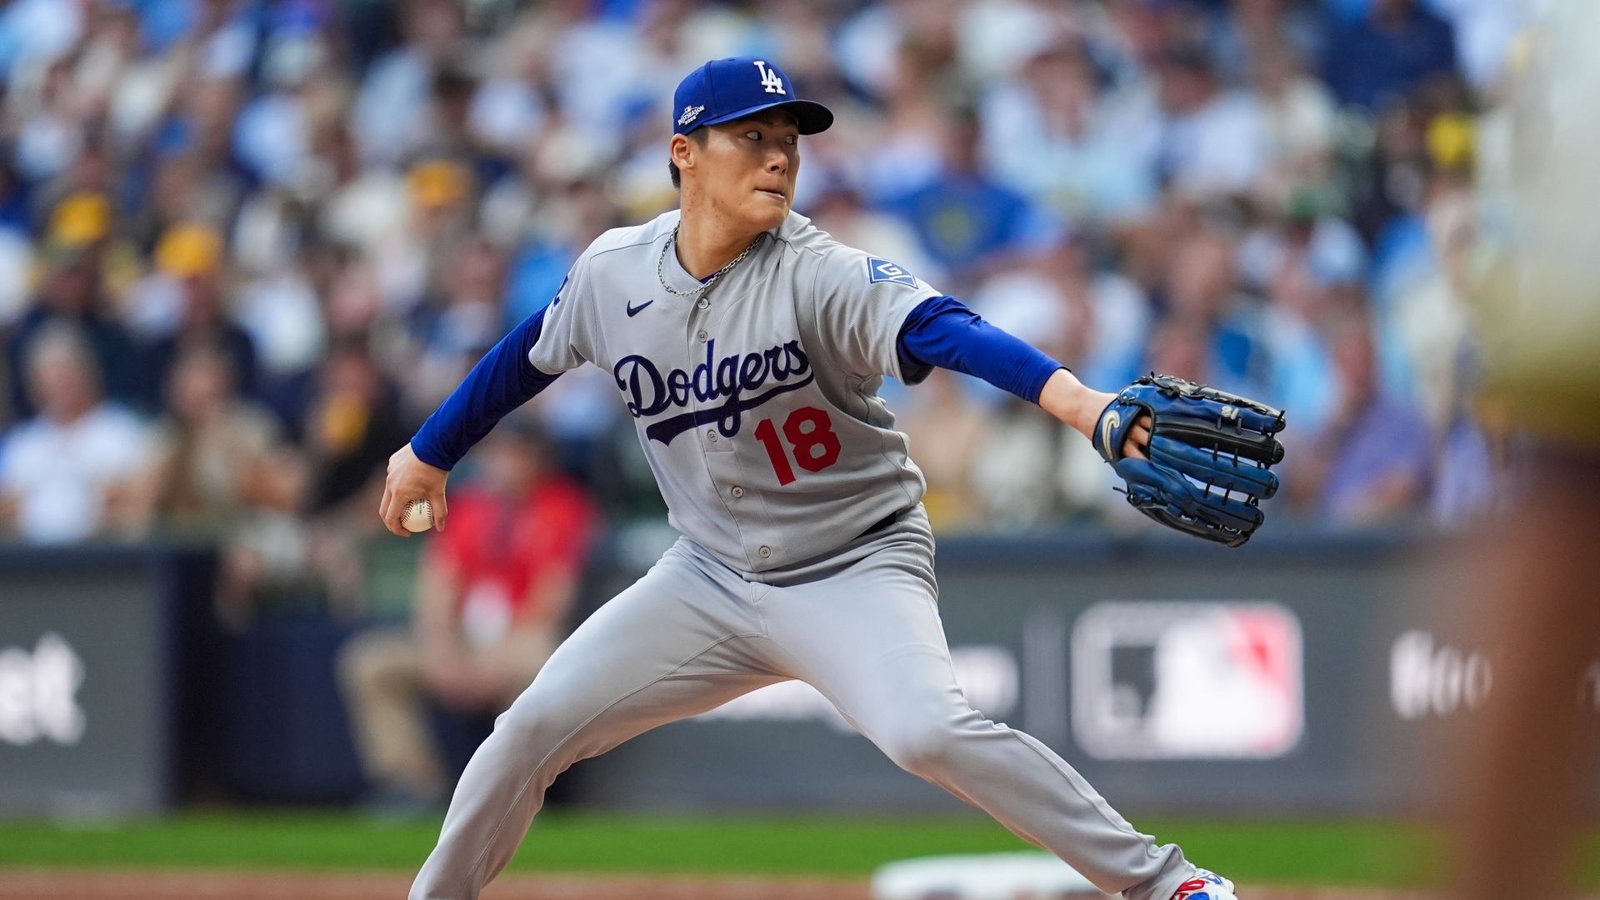
Jake Bauers reached a full count on Yoshinobu Yamamoto’s sixth pitch to him, a 97.0-mph fastball that he fouled off. Five more fouls followed, against four different pitch classifications. When Bauers finally took a 79.2-mph curveball below the strike zone, Yamamoto had spent 12 pitches on a walk that loaded the bases with two outs in the third inning.
Christian Yelich singled on the next at-bat’s second pitch, scoring David Hamilton and Brice Turang. Milwaukee led 3–2, and Yamamoto’s start ended after 75 pitches and eight outs. His final line was 2⅔ innings, four hits, three earned runs, two walks and one strikeout in the Brewers’ 7–4 victory at American Family Field on October 12.
The short outing was primarily a problem of finishing hitters. Yamamoto retained his usual fastball velocity, but Milwaukee missed only four times in 34 swing attempts. Nineteen other swings produced ordinary fouls. Those additional pitches, together with two walks in the third, kept him working through a lineup that did not need uniformly hard contact to create its lead.
Season repertoire and Game 2
Scale: 0–100%. Gray: regular season. Blue: Game 2.
Four-seam fastball
Change: +9.8 percentage points.
Cutter
Change: +5.1 percentage points.
Splitter
Change: -6.6 percentage points.
Curveball
Change: +0.2 percentage points.
Sinker
Change: -6.4 percentage points.
Slider
Change: -2.1 percentage points.
A familiar fastball speed with fewer finishes
The comparison begins with Yamamoto’s 28 regular-season starts, spanning March 26 through September 23 and containing 2,734 physical pitches. His whiff rate, misses divided by swings, was 27.9% in that sample. Against Milwaukee it was 11.8%, or four misses in 34 swings. The difference describes this matchup; it does not identify what the hitters expected or establish a permanent change in his pitches.
His previous postseason start provides a closer contrast. On October 6 against Atlanta, he recorded 10 strikeouts over seven innings, throwing 98 pitches and producing 17 misses in 46 swings. His four-seamer averaged 96.6 mph that night. It averaged 96.5 mph in Game 2, with almost identical inning averages across the first, second and third.
The fastball accounted for 27 of Monday’s 75 pitches, or 36.0%, compared with 26.2% during the regular season. Yet the Brewers contacted all 12 four-seamers at which they swung. Five additional fastballs became called strikes. The pitch could acquire a strike when taken, but in this outing it supplied no swing-and-miss finish.
The splitter’s share moved in the other direction, from 26.6% in the regular season to 20.0%, or 15 pitches. It generated two misses in five swings. Yamamoto also used 15 cutters, 10 curveballs, five sinkers and three sliders. The cutter and slider supplied the remaining two misses, while all three swings at curveballs made contact.
Bauers’ confrontation connected those aggregate figures to an actual sequence. He took a low splitter for ball one, then a splitter for a called strike. A fastball above the zone and a called curveball brought the count to 2–2. Another splitter missed, and the ensuing six full-count fouls kept the at-bat alive before the final low curve.
The six fouls were not six repetitions of one pitch. Yamamoto alternated fastballs with a curveball, sinker, cutter and splitter. Some finished outside the geometric strike-zone rectangle used in the tracking comparison. Contact with those pitches prevented an immediate walk, but it also prevented the strikeout or ball in play that would have ended the confrontation.
Jake Bauers: inning 3
Workload grew without a broad surge in hard contact
Milwaukee’s offense did not consist entirely of forceful contact. Only two of its 11 measured balls in play against Yamamoto reached 95 mph, the Statcast threshold for a hard-hit ball. Their average exit velocity was 83.1 mph, below his 86.8-mph regular-season contact average. That complicates an explanation based simply on the Brewers hitting everything hard.
The first inning nevertheless took 25 pitches. Turang doubled, and William Contreras’ soft line-drive single brought him home. Yamamoto then retired Bauers on a foul popup caught by Will Smith and Yelich on a grounder. The second inning was cleaner: three outs on 14 pitches. After two innings, his workload stood at 39.
In the third, Hamilton’s leadoff single and Turang’s walk created two runners before Bauers came up. William Contreras’ seven-pitch flyout also added work. The inning consumed 36 pitches for only two outs, including nine ordinary fouls across the outing with two strikes already on the hitter. Bauers’ walk occupied 12 of those 36 pitches.
There were still useful taken strikes: 12 across the start, including five four-seamers. The limitation was what happened after a hitter offered. Foul contact repeatedly prolonged opportunities, and the final Yelich single converted the accumulated runners into runs. Alex Vesia then struck out Garrett Mitchell, stranding Yamamoto’s remaining two runners.
The pitch record supports an explanation based on sustained contact and extended plate appearances, with a reduced splitter share alongside increased fastball use. It cannot establish that a deliberate repertoire change caused the result. Different opponents, counts and hitter handedness also affect selection, and the measured speeds do not support a general fastball-velocity decline.
The next useful test is whether Yamamoto again obtains misses from his fastball and converts two-strike counts into outs while maintaining that speed. Monday’s evidence identifies where this start became inefficient without turning one difficult matchup into a diagnosis.
Inning samples in context
| Inning | Pitches | Cumulative | Four-seam fastball mph | Measured n | Outs |
|---|---|---|---|---|---|
| 1 | 25 | 25 | 96.5 | 10 | 3 |
| 2 | 14 | 39 | 96.5 | 5 | 3 |
| 3* | 36 | 75 | 96.5 | 12 | 2 |
Every pitch: 75 of 75
Search a hitter, select an inning or pitch type, then inspect a pitch number. Pitch result and completed plate-appearance outcome are separate columns. The table scrolls within its border.
75 of 75 pitches
No pitches match these filters.
| Pitch | Inning | Hitter | Count before | Type | mph | Pitch result | Completed PA |
|---|---|---|---|---|---|---|---|
| 1 | Jackson Chourio | 0–0 | FC | 92.9 | Swinging Strike | Strikeout | |
| 1 | Jackson Chourio | 0–1 | FC | 91.3 | Ball | Strikeout | |
| 1 | Jackson Chourio | 1–1 | SI | 95.9 | Foul | Strikeout | |
| 1 | Jackson Chourio | 1–2 | FS | 91.0 | Foul | Strikeout | |
| 1 | Jackson Chourio | 1–2 | SL | 87.7 | Swinging Strike | Strikeout | |
| 1 | Brice Turang | 0–0 | FF | 97.6 | Called Strike | Double | |
| 1 | Brice Turang | 0–1 | FF | 95.7 | Foul Bunt | Double | |
| 1 | Brice Turang | 0–2 | FS | 91.2 | Ball | Double | |
| 1 | Brice Turang | 1–2 | FC | 94.0 | Ball | Double | |
| 1 | Brice Turang | 2–2 | FF | 96.3 | Ball | Double | |
| 1 | Brice Turang | 3–2 | FF | 97.3 | In play, no out | Double | |
| 1 | William Contreras | 0–0 | FF | 95.9 | Foul | Single | |
| 1 | William Contreras | 0–1 | FF | 96.6 | Called Strike | Single | |
| 1 | William Contreras | 0–2 | FF | 96.4 | Ball | Single | |
| 1 | William Contreras | 1–2 | FS | 92.7 | Ball In Dirt | Single | |
| 1 | William Contreras | 2–2 | SL | 86.8 | In play, run(s) | Single | |
| 1 | Jake Bauers | 0–0 | CU | 76.0 | Ball | Pop Out | |
| 1 | Jake Bauers | 1–0 | FF | 96.4 | Foul | Pop Out | |
| 1 | Jake Bauers | 1–1 | FS | 91.4 | Ball | Pop Out | |
| 1 | Jake Bauers | 2–1 | FS | 90.9 | Foul | Pop Out | |
| 1 | Jake Bauers | 2–2 | FF | 95.9 | In play, out(s) | Pop Out | |
| 1 | Christian Yelich | 0–0 | CU | 76.2 | Ball | Groundout | |
| 1 | Christian Yelich | 1–0 | CU | 75.9 | Called Strike | Groundout | |
| 1 | Christian Yelich | 1–1 | FF | 96.4 | Ball | Groundout | |
| 1 | Christian Yelich | 2–1 | FC | 92.0 | In play, out(s) | Groundout | |
| 2 | Garrett Mitchell | 0–0 | FS | 92.4 | Ball | Groundout | |
| 2 | Garrett Mitchell | 1–0 | FS | 91.3 | Swinging Strike | Groundout | |
| 2 | Garrett Mitchell | 1–1 | FS | 90.9 | Swinging Strike | Groundout | |
| 2 | Garrett Mitchell | 1–2 | FF | 97.0 | In play, out(s) | Groundout | |
| 2 | Cooper Pratt | 0–0 | FF | 95.8 | Foul | Groundout | |
| 2 | Cooper Pratt | 0–1 | FC | 89.6 | Called Strike | Groundout | |
| 2 | Cooper Pratt | 0–2 | FC | 90.2 | In play, out(s) | Groundout | |
| 2 | Sal Frelick | 0–0 | FF | 96.5 | Ball | Flyout | |
| 2 | Sal Frelick | 1–0 | FF | 96.8 | Ball | Flyout | |
| 2 | Sal Frelick | 2–0 | CU | 75.5 | Ball | Flyout | |
| 2 | Sal Frelick | 3–0 | FF | 96.2 | Called Strike | Flyout | |
| 2 | Sal Frelick | 3–1 | FC | 90.6 | Called Strike | Flyout | |
| 2 | Sal Frelick | 3–2 | CU | 77.9 | Foul | Flyout | |
| 2 | Sal Frelick | 3–2 | SI | 94.8 | In play, out(s) | Flyout | |
| 3 | David Hamilton | 0–0 | CU | 69.5 | Ball | Single | |
| 3 | David Hamilton | 1–0 | FC | 91.0 | Ball | Single | |
| 3 | David Hamilton | 2–0 | FC | 89.9 | Called Strike | Single | |
| 3 | David Hamilton | 2–1 | FF | 96.2 | Called Strike | Single | |
| 3 | David Hamilton | 2–2 | FS | 92.3 | Ball | Single | |
| 3 | David Hamilton | 3–2 | FC | 91.3 | In play, no out | Single | |
| 3 | Jackson Chourio | 0–0 | SL | 86.8 | Called Strike | Lineout | |
| 3 | Jackson Chourio | 0–1 | FF | 95.5 | Foul | Lineout | |
| 3 | Jackson Chourio | 0–2 | FF | 97.2 | In play, out(s) | Lineout | |
| 3 | Brice Turang | 0–0 | FF | 95.9 | Called Strike | Walk | |
| 3 | Brice Turang | 0–1 | FC | 94.2 | Foul | Walk | |
| 3 | Brice Turang | 0–2 | FF | 96.7 | Ball | Walk | |
| 3 | Brice Turang | 1–2 | FF | 96.3 | Ball | Walk | |
| 3 | Brice Turang | 2–2 | FS | 93.0 | Ball In Dirt | Walk | |
| 3 | Brice Turang | 3–2 | FC | 91.1 | Ball | Walk | |
| 3 | William Contreras | 0–0 | FC | 92.7 | Foul | Flyout | |
| 3 | William Contreras | 0–1 | FF | 95.8 | Ball | Flyout | |
| 3 | William Contreras | 1–1 | SI | 96.6 | Ball | Flyout | |
| 3 | William Contreras | 2–1 | FC | 93.6 | Foul | Flyout | |
| 3 | William Contreras | 2–2 | SI | 95.7 | Foul | Flyout | |
| 3 | William Contreras | 2–2 | FS | 93.0 | Ball In Dirt | Flyout | |
| 3 | William Contreras | 3–2 | FF | 96.9 | In play, out(s) | Flyout | |
| 3 | Jake Bauers | 0–0 | FS | 91.8 | Ball | Walk | |
| 3 | Jake Bauers | 1–0 | FS | 91.3 | Called Strike | Walk | |
| 3 | Jake Bauers | 1–1 | FF | 96.3 | Ball | Walk | |
| 3 | Jake Bauers | 2–1 | CU | 76.9 | Called Strike | Walk | |
| 3 | Jake Bauers | 2–2 | FS | 91.6 | Ball | Walk | |
| 3 | Jake Bauers | 3–2 | FF | 97.0 | Foul | Walk | |
| 3 | Jake Bauers | 3–2 | CU | 77.7 | Foul | Walk | |
| 3 | Jake Bauers | 3–2 | SI | 95.7 | Foul | Walk | |
| 3 | Jake Bauers | 3–2 | FF | 97.4 | Foul | Walk | |
| 3 | Jake Bauers | 3–2 | FC | 93.7 | Foul | Walk | |
| 3 | Jake Bauers | 3–2 | FS | 92.3 | Foul | Walk | |
| 3 | Jake Bauers | 3–2 | CU | 79.2 | Ball In Dirt | Walk | |
| 3 | Christian Yelich | 0–0 | FF | 96.6 | Ball | Single | |
| 3 | Christian Yelich | 1–0 | CU | 76.9 | In play, run(s) | Single |
Sources, definitions and limitations
The official final MLB record supplies events, final calls and the line. Baseball Savant’s complete Game 2 feed supplies all 75 physical pitches. Pitch ID, order, classification and pre-pitch count reconcile, including final ABS decisions. These records contain 14 batters, 8 integer outs and 1 strikeouts. In baseball notation, .1 means one out and .2 two outs. Source records current as of October 13, 2026.
The Statcast Search baseline is 2,734 physical pitches in 28 regular-season starter appearances for Los Angeles Dodgers, 2026-03-26 through 2026-09-23. Each game total reconciles with the official appearance log. The target game and postseason work are excluded. Same club and role in the 2026 regular season. 1 baseline pitches lack start speed; excluded from that measure. 1 baseline pitches lack spin rate; excluded from that measure. 2 baseline pitches lack extension; excluded from that measure.
Whiff rate means misses divided by physical swing attempts. Swinging strikes, blocked swinging strikes, caught foul tips and missed bunts count as conventional tracking whiffs. A caught foul tip involves bat contact; it is kept distinct from a literal swing that misses the ball. Fouls, bunt attempts and balls put into play enter the attempt denominator. Both outing and baseline use the same definitions. Called strikes and completed strikeout plate appearances are separate. Chase uses ball-center coordinates outside a 17-inch-wide rectangle and each pitch’s recorded vertical boundaries. Only complete coordinates enter the zone denominator. Savant’s separate zone flag remains in the CSV and detail rather than replacing that geometric definition.
Speed is mph, spin rpm, extension feet and movement inches. Induced vertical break describes movement relative to a gravity-only path. Location and zone boundaries are feet in catcher view. Numbered markers preserve exact coordinates and are not ball size. Release, location, spin, extension and movement measurements are complete for all outing pitches. Contact and expected-outcome measurements can be unavailable and remain missing in the detail and CSV. 11 of 11 balls put into play have measured exit speed. Hard-hit means at least 95 mph; the baseline has 475 measured contacts among 477. Expected outcomes are Savant model estimates, not actual results. The comparisons are descriptive and do not establish intention, fatigue, injury or a durable trend.