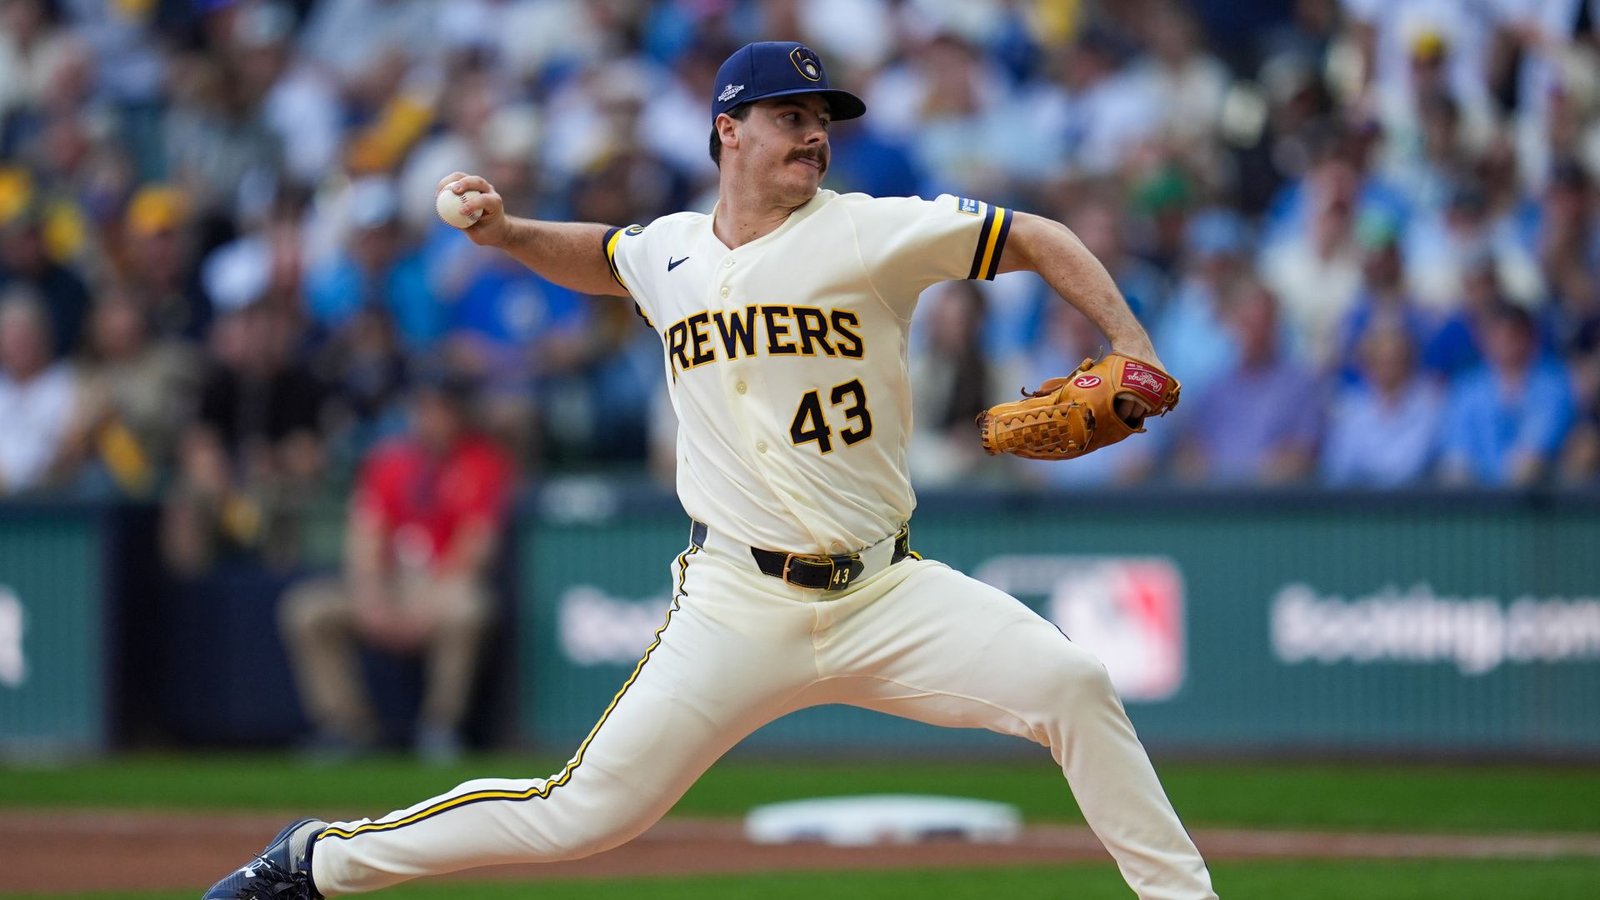
Logan Henderson finished the first inning with three fastballs to Shohei Ohtani. The first was called a strike, the second drew a miss, and the third, at 94.6 mph, finished above Ohtani’s recorded strike-zone boundary and drew another miss for strike three.
That sequence revealed the most effective part of Henderson’s arsenal in NLCS Game 2. His four-seamer supplied eight of nine recorded whiffs across 64 pitches. The rest of his outing required a different explanation: Los Angeles scored four runs without a run-scoring hit, aided by two throwing errors charged to Henderson.
The Milwaukee starter recorded four innings, allowing three hits, four runs, two earned, and two walks with two strikeouts at American Family Field on October 12. He faced two more hitters in the fifth without recording an out. Dustin May then retired three consecutive batters, although the runner he inherited from Henderson scored on a sacrifice fly. The Brewers ultimately won 7–4.
Season repertoire and Game 2
Scale: 0–100%. Gray: regular season. Blue: Game 2.
Four-seam fastball
Change: +5.1 percentage points.
Changeup
Change: -7.1 percentage points.
Cutter
Change: -1.2 percentage points.
Sweeper
Change: +3.1 percentage points.
More four-seamers and a changeup without a miss
Henderson’s regular-season baseline contains 1,505 physical pitches from 18 Brewers starts, April 4 through September 23. His fastball made up 46.4% of that sample and averaged 93.1 mph. In Game 2, he threw 33 four-seamers, a 51.6% share, at an average of 93.9 mph. The modest increase in usage accompanied a harder average pitch.
The fastball generated eight recorded whiffs in 20 swing attempts and six called strikes. One of those whiffs was a caught foul tip, which involves bat contact but belongs in the conventional tracking whiff count. Ohtani’s three-pitch strikeout shows the cleaner swing-and-miss version: a taken fastball followed by two unsuccessful swings.
The changeup remained prominent, with 18 pitches and a 28.1% share, down from 35.2% during the regular season. None of its eight swings produced a whiff. Henderson also used nine cutters and four sweepers. The cutter supplied his only whiff outside the four-seam classification.
That concentration matters without proving the changeup failed as a whole. A pitch can contribute through a taken strike or a useful ball in play. Henderson recorded two called strikes with changeups, and his overall whiff rate was 25.7%, close to the regular-season 26.5%. He allowed 14 balls in play, so defense and contact outcomes occupied a large part of the outing.
His October 4 postseason start offers another comparison. Henderson threw 72 pitches in five innings, with four strikeouts and nine whiffs in 34 swings. He used 29 changeups that day, compared with 18 in Game 2. Monday’s fastball increase therefore coexisted with a lower changeup share against both the season sample and that prior start.
Shohei Ohtani: inning 1
The pitch ledger cannot replace the throwing record
The first Dodgers run began with Mookie Betts’ leadoff walk. He advanced on Freddie Freeman’s groundout and Henderson’s wild pitch before Teoscar Hernández’s sacrifice fly. Henderson’s subsequent strikeout of Ohtani limited that inning, but the fastball finish did not erase the earlier baserunner and advancement.
In the third, Tommy Edman and Betts singled. Freeman then hit a ball that Sal Frelick caught near the right-field warning track. With Edman at third, Henderson’s errant pickoff throw during Hernández’s plate appearance brought him home. That throw belongs to the game’s event record rather than the physical pitch ledger.
Henderson retired the side on eight pitches in the fourth, entering the fifth with 59 pitches and a 3–2 lead. Kyle Tucker doubled to begin the inning. On Edman’s ensuing sacrifice bunt, Henderson’s throwing error allowed Tucker to score and Edman to reach second. Henderson departed after five pitches in that inning and no outs.
May’s groundout advanced Edman to third, and Freeman’s sacrifice fly scored him. Both fifth-inning runs remained charged to Henderson. Official earned-run accounting leaves two of the four total runs unearned; it does not turn the throwing errors into events unrelated to his outing.
Contact also deserves a qualification. Six of 14 measured balls in play reached 95 mph, compared with a 36.9% hard-hit rate in his regular-season sample. The average exit velocity, 87.2 mph, was close to his season 87.6 mph. Frelick’s catch demonstrates why a successful pitch result and a harmless contact result need not be the same thing.
Henderson’s fastball averaged 94.3 mph in the first inning and 92.4 mph across three measured four-seamers in the fifth. Those small inning samples show the observed change, not its cause. They cannot establish fatigue, especially when the final inning comprised only two hitters.
The useful conclusion is specific: Henderson retained a fastball capable of missing bats, but his secondary pitches supplied little swing-and-miss support and his own throwing errors changed the scoring. A future outing would test whether the changeup again contributes finishes and whether cleaner handling of runners lets his pitch execution translate into a better line.
Inning samples in context
| Inning | Pitches | Cumulative | Four-seam fastball mph | Measured n | Outs |
|---|---|---|---|---|---|
| 1 | 16 | 16 | 94.3 | 11 | 3 |
| 2 | 23 | 39 | 94.1 | 9 | 3 |
| 3 | 12 | 51 | 93.7 | 7 | 3 |
| 4 | 8 | 59 | 93.6 | 3 | 3 |
| 5* | 5 | 64 | 92.4 | 3 | 0 |
Every pitch: 64 of 64
Search a hitter, select an inning or pitch type, then inspect a pitch number. Pitch result and completed plate-appearance outcome are separate columns. The table scrolls within its border.
64 of 64 pitches
No pitches match these filters.
| Pitch | Inning | Hitter | Count before | Type | mph | Pitch result | Completed PA |
|---|---|---|---|---|---|---|---|
| 1 | Mookie Betts | 0–0 | FF | 92.4 | Called Strike | Walk | |
| 1 | Mookie Betts | 0–1 | FF | 94.9 | Ball | Walk | |
| 1 | Mookie Betts | 1–1 | FC | 89.6 | Ball | Walk | |
| 1 | Mookie Betts | 2–1 | FF | 92.3 | Foul Tip | Walk | |
| 1 | Mookie Betts | 2–2 | CH | 83.0 | Ball | Walk | |
| 1 | Mookie Betts | 3–2 | CH | 80.1 | Ball | Walk | |
| 1 | Freddie Freeman | 0–0 | FF | 92.6 | Called Strike | Groundout | |
| 1 | Freddie Freeman | 0–1 | FC | 90.0 | In play, out(s) | Groundout | |
| 1 | Teoscar Hernández | 0–0 | FF | 94.6 | Called Strike | Sac Fly | |
| 1 | Teoscar Hernández | 0–1 | FF | 95.6 | Foul | Sac Fly | |
| 1 | Teoscar Hernández | 0–2 | FF | 95.7 | Foul | Sac Fly | |
| 1 | Teoscar Hernández | 0–2 | CH | 83.3 | Ball | Sac Fly | |
| 1 | Teoscar Hernández | 1–2 | FF | 96.6 | In play, run(s) | Sac Fly | |
| 1 | Shohei Ohtani | 0–0 | FF | 93.9 | Called Strike | Strikeout | |
| 1 | Shohei Ohtani | 0–1 | FF | 94.3 | Swinging Strike | Strikeout | |
| 1 | Shohei Ohtani | 0–2 | FF | 94.6 | Swinging Strike | Strikeout | |
| 2 | Will Smith | 0–0 | FF | 92.2 | Called Strike | Lineout | |
| 2 | Will Smith | 0–1 | FC | 88.6 | Ball | Lineout | |
| 2 | Will Smith | 1–1 | FC | 87.6 | Ball | Lineout | |
| 2 | Will Smith | 2–1 | FC | 88.2 | Foul | Lineout | |
| 2 | Will Smith | 2–2 | FC | 88.7 | In play, out(s) | Lineout | |
| 2 | Max Muncy | 0–0 | CH | 84.6 | Ball | Strikeout | |
| 2 | Max Muncy | 1–0 | CH | 83.9 | Called Strike | Strikeout | |
| 2 | Max Muncy | 1–1 | CH | 84.3 | Foul | Strikeout | |
| 2 | Max Muncy | 1–2 | CH | 84.2 | Foul | Strikeout | |
| 2 | Max Muncy | 1–2 | FF | 94.4 | Swinging Strike | Strikeout | |
| 2 | Andy Pages | 0–0 | FF | 94.9 | Swinging Strike | Walk | |
| 2 | Andy Pages | 0–1 | FF | 94.4 | Ball | Walk | |
| 2 | Andy Pages | 1–1 | FC | 88.9 | Swinging Strike | Walk | |
| 2 | Andy Pages | 1–2 | FF | 94.4 | Ball | Walk | |
| 2 | Andy Pages | 2–2 | CH | 84.9 | Ball | Walk | |
| 2 | Andy Pages | 3–2 | FF | 94.2 | Foul | Walk | |
| 2 | Andy Pages | 3–2 | FF | 93.8 | Ball | Walk | |
| 2 | Kyle Tucker | 0–0 | FC | 88.6 | Foul | Lineout | |
| 2 | Kyle Tucker | 0–1 | CH | 84.7 | Foul | Lineout | |
| 2 | Kyle Tucker | 0–2 | FF | 94.4 | Ball | Lineout | |
| 2 | Kyle Tucker | 1–2 | CH | 83.3 | Ball | Lineout | |
| 2 | Kyle Tucker | 2–2 | CH | 83.3 | Foul | Lineout | |
| 2 | Kyle Tucker | 2–2 | FF | 94.0 | In play, out(s) | Lineout | |
| 3 | Tommy Edman | 0–0 | FF | 92.0 | Ball | Single | |
| 3 | Tommy Edman | 1–0 | FF | 92.1 | In play, no out | Single | |
| 3 | Mookie Betts | 0–0 | FF | 92.9 | In play, no out | Single | |
| 3 | Freddie Freeman | 0–0 | CH | 84.4 | Called Strike | Flyout | |
| 3 | Freddie Freeman | 0–1 | CH | 83.9 | In play, out(s) | Flyout | |
| 3 | Teoscar Hernández | 0–0 | FF | 95.2 | Swinging Strike | Groundout | |
| 3 | Teoscar Hernández | 0–1 | CH | 84.8 | Foul | Groundout | |
| 3 | Teoscar Hernández | 0–2 | ST | 82.1 | In play, out(s) | Groundout | |
| 3 | Shohei Ohtani | 0–0 | FF | 94.2 | Swinging Strike | Groundout | |
| 3 | Shohei Ohtani | 0–1 | FF | 94.5 | Foul | Groundout | |
| 3 | Shohei Ohtani | 0–2 | CH | 85.2 | Ball In Dirt | Groundout | |
| 3 | Shohei Ohtani | 1–2 | FF | 94.9 | In play, out(s) | Groundout | |
| 4 | Will Smith | 0–0 | FF | 91.5 | Called Strike | Lineout | |
| 4 | Will Smith | 0–1 | ST | 80.5 | Ball | Lineout | |
| 4 | Will Smith | 1–1 | ST | 80.4 | In play, out(s) | Lineout | |
| 4 | Max Muncy | 0–0 | CH | 84.2 | In play, out(s) | Pop Out | |
| 4 | Andy Pages | 0–0 | ST | 82.1 | Called Strike | Flyout | |
| 4 | Andy Pages | 0–1 | FF | 93.8 | Swinging Strike | Flyout | |
| 4 | Andy Pages | 0–2 | FF | 95.6 | Ball | Flyout | |
| 4 | Andy Pages | 1–2 | CH | 83.1 | In play, out(s) | Flyout | |
| 5 | Kyle Tucker | 0–0 | FF | 92.5 | Foul | Double | |
| 5 | Kyle Tucker | 0–1 | FC | 89.8 | Ball | Double | |
| 5 | Kyle Tucker | 1–1 | FF | 92.3 | In play, no out | Double | |
| 5 | Tommy Edman | 0–0 | CH | 83.8 | Ball | Sac Bunt | |
| 5 | Tommy Edman | 1–0 | FF | 92.5 | In play, run(s) | Sac Bunt |
Sources, definitions and limitations
The official final MLB record supplies events, final calls and the line. Baseball Savant’s complete Game 2 feed supplies all 64 physical pitches. Pitch ID, order, classification and pre-pitch count reconcile, including final ABS decisions. These records contain 18 batters, 12 integer outs and 2 strikeouts. In baseball notation, .1 means one out and .2 two outs. Source records current as of October 13, 2026.
The Statcast Search baseline is 1,505 physical pitches in 18 regular-season starter appearances for Milwaukee Brewers, 2026-04-04 through 2026-09-23. Each game total reconciles with the official appearance log. The target game and postseason work are excluded. Same club and role in the 2026 regular season.
Whiff rate means misses divided by physical swing attempts. Swinging strikes, blocked swinging strikes, caught foul tips and missed bunts count as conventional tracking whiffs. A caught foul tip involves bat contact; it is kept distinct from a literal swing that misses the ball. Fouls, bunt attempts and balls put into play enter the attempt denominator. Both outing and baseline use the same definitions. Called strikes and completed strikeout plate appearances are separate. Chase uses ball-center coordinates outside a 17-inch-wide rectangle and each pitch’s recorded vertical boundaries. Only complete coordinates enter the zone denominator. Savant’s separate zone flag remains in the CSV and detail rather than replacing that geometric definition.
Speed is mph, spin rpm, extension feet and movement inches. Induced vertical break describes movement relative to a gravity-only path. Location and zone boundaries are feet in catcher view. Numbered markers preserve exact coordinates and are not ball size. Release, location, spin, extension and movement measurements are complete for all outing pitches. Contact and expected-outcome measurements can be unavailable and remain missing in the detail and CSV. 14 of 14 balls put into play have measured exit speed. Hard-hit means at least 95 mph; the baseline has 241 measured contacts among 241. Expected outcomes are Savant model estimates, not actual results. The comparisons are descriptive and do not establish intention, fatigue, injury or a durable trend.