
MLB · Pitching Data
Bryan Baker Extends Scoreless Streak to 12 Outings in Game 4
The Rays closer has allowed no runs in 12 1/3 innings across the regular season and postseason. His 12-pitch Game 4 ninth also came with a fastball averaging 3.8 mph below his regular-season baseline.
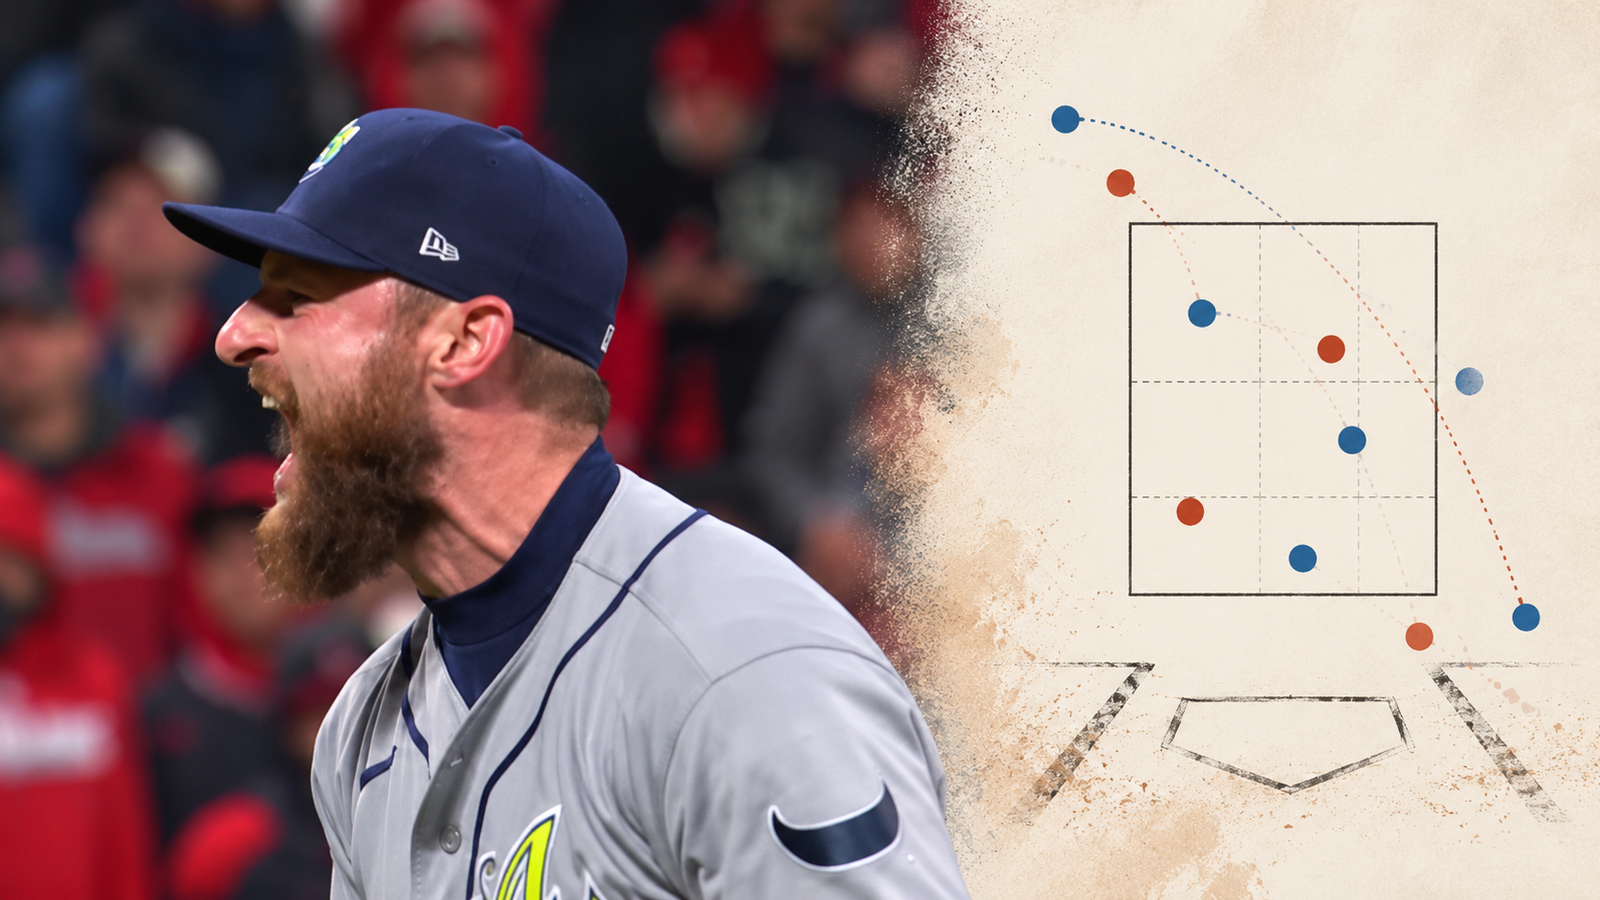
Angel Martínez had watched two changeups miss and then reached a 3–1 count in the ninth inning. Bryan Baker’s next fastball was fouled away below the recorded strike zone. His next one, at 92.7 mph, reached the left edge of the plate and produced the swing that ended the game.
Baker closed Tampa Bay’s 7–3 win over Cleveland in Game 4 of the American League Championship Series on October 17 with one scoreless inning, one hit and one strikeout. He has allowed no runs in 12 consecutive appearances covering 12 1/3 innings across the regular season and postseason. Saturday’s four-run margin did not produce another save opportunity.
The 12-pitch inning extended the scoreless result through an established fastball/changeup combination and a recovery from behind in the final count. It also supplied a qualification: his seven four-seamers averaged 92.5 mph, well below his regular-season baseline. That average was 3.8 mph below his regular-season four-seamer.
How far the scoreless run extends
The longer run began September 8 and continued through October 17. Baker allowed five hits and three walks with nine strikeouts while recording 37 outs in that stretch. His last charged run came against Texas on September 4, when he recorded no outs.
The postseason portion is five scoreless innings in five appearances from October 3–17, with neither earned nor unearned runs allowed. That work covers 16 batters and 60 pitches. Four appearances ended in saves; Game 4 ended with the same pitcher on the mound but a larger lead.
His save-conversion streak is a separate measure: 34 successful opportunities in a row across the regular season and postseason since May 17, consisting of 30 regular-season saves and four in October. Game 4 left that number unchanged. Those 34 successful save appearances included three runs allowed.
A familiar selection with different speed
Baker threw seven four-seam fastballs and five changeups. Those shares, 58.3% and 41.7%, were close to his regular-season split of 52.9% fastballs, 43.8% changeups and 3.3% sliders. The comparison covers 977 physical pitches in 65 appearances from March 28 through September 25 and excludes the postseason.
All three Cleveland hitters batted left-handed. Against left-handed hitters in the regular season, Baker had used fastballs 50.3% of the time and changeups 49.1%. Twelve pitches cannot establish a strategic shift, particularly when four consecutive fastballs to the last batter account for a third of the inning’s entire sample.
The more conspicuous difference was speed. His regular-season four-seamer averaged 96.3 mph over 517 pitches. Saturday’s average was 3.8 mph lower, and the fastest of his seven fastballs was 92.7. The five changeups averaged 83.6 mph, compared with 85.2 during the regular season.
Those readings establish a difference, not its cause. One inning cannot diagnose fatigue, injury or a deliberate change in effort. It does make velocity a specific point of comparison for his next appearance rather than something to erase because he allowed no runs.
How the inning produced three outs
Travis Bazzana opened with a line-drive single off a changeup, measured at 98.9 mph with an 18-degree launch angle. The hardest of the inning’s two balls in play came before Baker had recorded an out. Both balls put in play against Baker came off the changeup.
Patrick Bailey then missed a fastball and a changeup to fall behind 0–2. Baker’s next changeup produced a 91.5 mph ground ball with a 2-degree launch angle. Jonathan Aranda and Taylor Walls converted it into a double play. The low flight gave Tampa Bay two outs from one contact event, but the fielders’ conversion belongs in the explanation alongside the pitch.
The strikeout of Martínez required a different route. Baker started with changeups at 81.3 and 82.7 mph, both balls. A 92.5 mph fastball was taken for a strike before another fastball missed, creating the 3–1 count. The foul at 92.2 kept the at-bat alive; the next fastball finished it.
Fastballs supplied both called strikes and two of Baker’s three swinging strikes. None was put in play. His six swings produced three misses, but that small denominator is the useful description of this inning, not evidence that he has established a sustainable 50% whiff rate.
What another scoreless inning establishes
Baker needed only three batters to record three outs despite allowing the first hitter to reach. The double play helped keep the workload at 12 pitches, and the last at-bat showed him recovering after two early balls without issuing a walk. Those are concrete reasons the inning stayed scoreless.
The October line contains one hit, one walk and six strikeouts in five innings. Game 4 added the first hit to that record, then immediately removed the runner on the double play. That sequence is part of why a scoreless streak can continue even when a hitter connects solidly.
The next question is whether Baker’s fastball returns toward its regular-season speed or remains near 92–93 mph, and how he acquires strikes if hitters take more changeups. The next outing will show whether this was an isolated low-velocity inning.
Explore all 12 pitches
Filter the complete physical-pitch record. Count is before each pitch. Pitch result and plate-appearance result are separate. Select a pitch number for its measurements.
12 of 12 pitches
No pitches match these filters.
| Pitch | Inning | Hitter | Count before | Type | mph | Pitch result | PA result |
|---|---|---|---|---|---|---|---|
| 9 | Travis Bazzana | 0–0 | Four-Seam Fastball | 92.5 | Ball | Single | |
| 9 | Travis Bazzana | 1–0 | Four-Seam Fastball | 92.0 | Called Strike | Single | |
| 9 | Travis Bazzana | 1–1 | Changeup | 84.2 | In play, no out | Single | |
| 9 | Patrick Bailey | 0–0 | Four-Seam Fastball | 92.7 | Swinging Strike | Grounded Into DP | |
| 9 | Patrick Bailey | 0–1 | Changeup | 85.1 | Swinging Strike | Grounded Into DP | |
| 9 | Patrick Bailey | 0–2 | Changeup | 84.6 | In play, out(s) | Grounded Into DP | |
| 9 | Angel Martínez | 0–0 | Changeup | 81.3 | Ball | Strikeout | |
| 9 | Angel Martínez | 1–0 | Changeup | 82.7 | Ball | Strikeout | |
| 9 | Angel Martínez | 2–0 | Four-Seam Fastball | 92.5 | Called Strike | Strikeout | |
| 9 | Angel Martínez | 2–1 | Four-Seam Fastball | 92.6 | Ball | Strikeout | |
| 9 | Angel Martínez | 3–1 | Four-Seam Fastball | 92.2 | Foul | Strikeout | |
| 9 | Angel Martínez | 3–2 | Four-Seam Fastball | 92.7 | Swinging Strike | Strikeout |
Sources, definitions and limitations
The official MLB final game record supplies calls, sequence, pitching lines and outs. Baseball Savant’s complete gamefeed supplies reconciled tracking, and Statcast Search supplies the regular-season comparison. Source retrieval: October 18, 2026, 12:01 a.m. MDT, after Game 4 was final. The target outing is October 17.
The complete 12-pitch record reconciles physical pitch IDs, classifications, count before each pitch, batters and strikeouts with MLB and Savant. Automatic calls and other nonpitch events are excluded from physical pitch totals and retained in the private event audit. All outing pitches have speed, spin, extension, induced vertical break and plate coordinates; all balls in play have measured exit speed and launch angle. Missing contact and expected-outcome measurements remain blank rather than zero.
The primary comparison contains 977 physical pitches in 65 regular-season appearances, March 28–September 25, 2026. Four automatic balls are excluded. It excludes postseason games and the target outing. Per-game physical pitch totals reconcile to the official regular-season game log. The same definitions are used within each paper’s outing and baseline calculations.
The Baker diagram and pitch detail use Savant plate coordinates and recorded batter-specific zone boundaries. Inside-zone classification uses the ball center within the 17-inch plate and the recorded vertical zone. Swings include misses, fouls, caught foul tips, bunts and balls in play; caught foul tips count as misses. The two sources’ plate-coordinate fields differ slightly; raw fields are retained separately. A recorded location is not proof of an intended target. Whiff rate means misses divided by defined swings. Called strikes are separate from misses. Hard-hit means exit velocity of at least 95 mph. Induced vertical break is inches relative to a gravity-only path, not physical rise. Speed is mph, spin rpm, extension and plate location feet. Expected batting average is Savant’s estimate, not an actual result. Statcast field definitions.
Innings are calculated from integer outs; .1 means one out and .2 means two. Baker’s scoreless and save streaks are separately reconciled from official postseason logs and regular-season logs. A 12-appearance span that includes both competitions is explicitly labeled. Small samples cannot establish intent, fatigue, injury or future performance.
Sources and notes
- Official MLB final Game 849816 and pitching game logs; Baseball Savant complete gamefeed and pregame 2026 regular-season export. Definitions, periods and limitations in article methods.