
MLB · Pitching Data
Bryan Baker Uses 10 Changeups to Close Rays’ ALCS Game 5 Win
Baker’s scoreless streak reached 13 appearances across the regular season and postseason. His 14-pitch save included an eight-pitch walk, hard fastball contact and two outs on changeups.
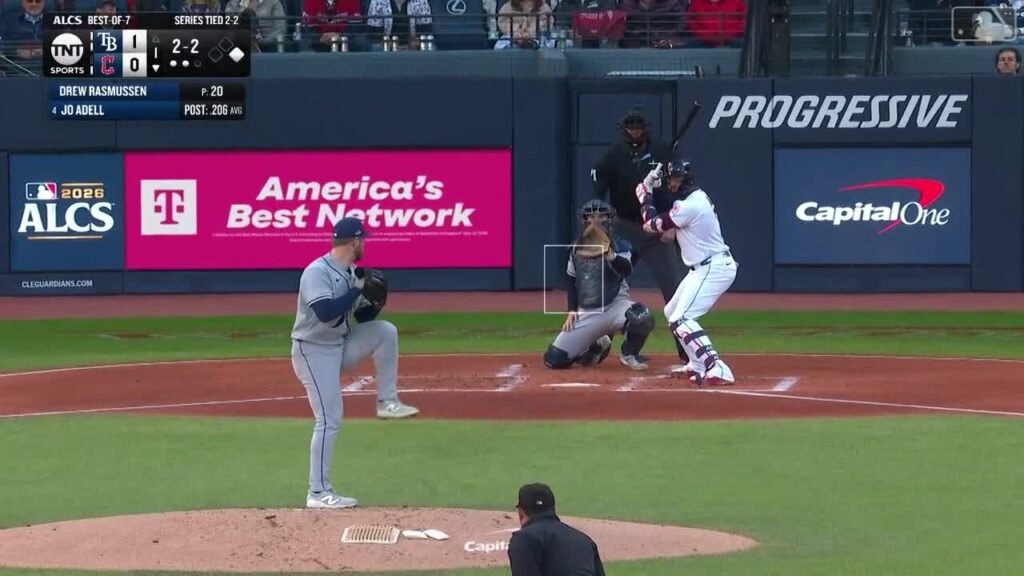
Bryan Baker opened the ninth inning with an eight-pitch walk to Chase DeLauter. Jo Adell hit the first pitch he saw at 106.9 mph, a ground ball to shortstop Taylor Walls, who threw to Richie Palacios for a forceout at second. Baker had his first out, but Cleveland still had a runner aboard and the tying run at the plate.
Baker then threw five consecutive changeups to finish the ninth inning of Tampa Bay’s 3–1 victory over Cleveland in ALCS Game 5 on Sunday, October 18, at Progressive Field. He earned his fifth postseason save with one hitless, scoreless inning, one walk and no strikeouts. The Rays took a 3–2 series lead and moved one win from the World Series.
The 14-pitch outing relied more heavily on the changeup than either his previous appearance or his regular season. It also showed why the save needs more explanation than the hit column: Baker issued a walk, allowed one sharply hit grounder and recorded all three outs on contact. His four-seam fastball was faster than in Game 4, while remaining below its regular-season average.
Ten changeups in a 14-pitch save
Baker threw 10 changeups and four four-seam fastballs, giving the changeup a 71.4% share. His 2026 regular-season baseline was 428 changeups among 977 physical pitches, or 43.8%. The increase was 27.6 percentage points, with no sliders in Game 5.
The immediate postseason comparison was different, too. In his 12-pitch Game 4 outing the previous night, Baker threw seven fastballs and five changeups. That game remains a separate postseason sample; it is not added to the regular-season baseline.
The hitters and counts matter to that comparison. Three of Sunday’s four batters hit left-handed, accounting for 13 pitches. Baker threw 10 changeups in that group, or 76.9%, compared with 49.1% against left-handed hitters during the regular season, 245 of 499 pitches. Adell, the only right-handed hitter, swung at the only pitch he saw. That uneven exposure limits what this inning can establish about a continuing change in selection.
The walk that consumed more than half the inning
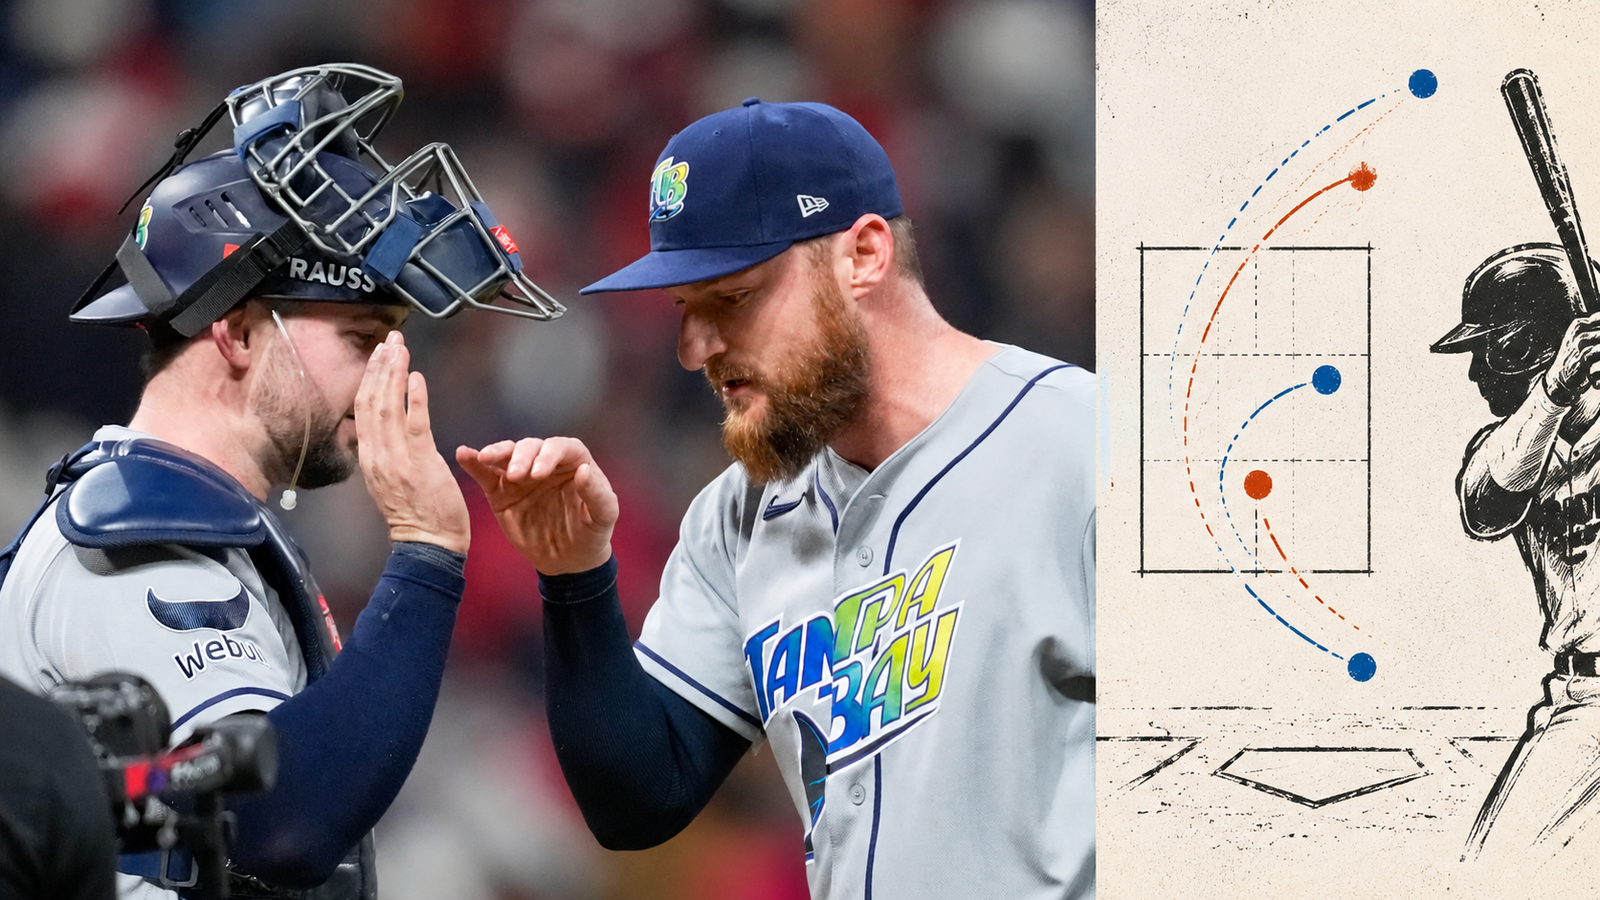
DeLauter’s eight pitches accounted for more than half of Baker’s total. Baker reached a 1–2 count with a called changeup strike followed by a called fastball strike at 93.8 mph. Two of his next three pitches were changeups below DeLauter’s recorded zone; DeLauter took both for balls, with a foul between them.
At 3–2, DeLauter fouled off a 92.8 mph fastball and watched a 93.7 mph fastball miss horizontally beyond the plate. The two-strike advantage had become a leadoff walk. The sequence supplies a counterweight to the higher changeup share: the pitch also contributed two of the balls that extended the inning.
Those locations describe where the pitches finished, not whether they missed a catcher’s intended target. The diagram uses Baseball Savant’s plate coordinates and the hitter’s recorded zone. Its ball-center rectangle is a measurement convention, not a replay judgment of the called strikes.
How the changeup produced the final two outs
Adell’s forceout came on Baker’s fastest pitch, a 94.8 mph four-seamer, with a launch angle of minus 10 degrees. It was the inning’s only hard-hit ball, using the 95 mph exit-speed threshold. Savant assigned the contact a .380 expected batting average. That estimate describes the tracked contact; it does not change the actual forceout or credit Baker with preventing a hard swing.
Against Nathaniel Lowe, Baker missed below the zone with an 84.1 mph changeup, then got a foul popup on an 81.8 mph changeup. Jonathan Aranda caught it near first base. The contact was measured at 69.6 mph with an 81-degree launch angle, a different kind of out from Adell’s low grounder.
Travis Bazzana then missed changeups at 81.1 and 85.4 mph, both below his recorded vertical zone. Baker’s third changeup, 84.0 mph, produced an 85.7 mph ground ball to Palacios for the final out. Adell had advanced to second on defensive indifference during the plate appearance; the advance was not a stolen base.
Baker’s seven swings produced two misses, both on changeups, alongside two fouls and three balls in play. He acquired two other strikes on takes. The final hitter’s early misses helped him reach a favorable count, but the inning ended with a groundout rather than a strikeout. Walls, Palacios and Aranda converted the contact into the three outs.
Fastball speed rises from Game 4, with a small sample
Sunday’s four fastballs averaged 93.8 mph. That was 1.3 mph above the seven-fastball average in Game 4, 92.5, and 2.5 mph below his regular-season average of 96.3 over 517 four-seamers. The changeup averaged 83.2 mph over 10 pitches, compared with 85.2 over 428 during the regular season.
The speed comparison describes two individual innings, not a diagnosis of Baker’s condition. There is no within-outing velocity trend to draw from one inning, and four fastballs do not establish a new normal. The workload was 14 pitches to four batters, including eight to the first and six to the remaining three combined.
Baker’s scoreless streak reaches 13 appearances
The scoreless stretch now covers 13 appearances and 13 1/3 innings from September 8 through October 18, combining the regular season and postseason. Baker has allowed five hits and four walks with nine strikeouts while recording 40 outs in that span. His last charged run came against Texas on September 4, when he recorded no outs.
The postseason portion is six scoreless innings across six appearances, with one hit, two walks and six strikeouts. He has converted all five October save opportunities. His regular-season pitch comparison covers a separate 65-appearance sample.
Game 5 extended the run through two softer changeup contacts after the opening walk and Adell’s hard grounder. The next useful test is whether Baker continues throwing changeups this often against left-handed hitters, and whether the fastball moves closer to its regular-season speed. This inning established how he finished a two-run save; it left those longer-term questions open.
Explore all 14 pitches
Filter the complete physical-pitch record. Count is before each pitch. Pitch result and plate-appearance result are separate. Select a pitch number for its measurements.
14 of 14 pitches
No pitches match these filters.
| Pitch | Inning | Hitter | Count before | Type | mph | Pitch result | PA result |
|---|---|---|---|---|---|---|---|
| 9 | Chase DeLauter | 0–0 | Changeup | 81.2 | Ball | Walk | |
| 9 | Chase DeLauter | 1–0 | Changeup | 80.5 | Called Strike | Walk | |
| 9 | Chase DeLauter | 1–1 | Four-Seam Fastball | 93.8 | Called Strike | Walk | |
| 9 | Chase DeLauter | 1–2 | Changeup | 84.9 | Ball | Walk | |
| 9 | Chase DeLauter | 2–2 | Changeup | 83.7 | Foul | Walk | |
| 9 | Chase DeLauter | 2–2 | Changeup | 84.9 | Ball | Walk | |
| 9 | Chase DeLauter | 3–2 | Four-Seam Fastball | 92.8 | Foul | Walk | |
| 9 | Chase DeLauter | 3–2 | Four-Seam Fastball | 93.7 | Ball | Walk | |
| 9 | Jo Adell | 0–0 | Four-Seam Fastball | 94.8 | In play, out(s) | Forceout | |
| 9 | Nathaniel Lowe | 0–0 | Changeup | 84.1 | Ball | Pop Out | |
| 9 | Nathaniel Lowe | 1–0 | Changeup | 81.8 | In play, out(s) | Pop Out | |
| 9 | Travis Bazzana | 0–0 | Changeup | 81.1 | Swinging Strike | Groundout | |
| 9 | Travis Bazzana | 0–1 | Changeup | 85.4 | Swinging Strike (Blocked) | Groundout | |
| 9 | Travis Bazzana | 0–2 | Changeup | 84.0 | In play, out(s) | Groundout |
Sources, definitions and limitations
The official MLB final game record and separate box score establish the sequence, pitching line and outs. Baseball Savant’s complete Game 5 feed supplies reconciled tracking coordinates and expected batting averages. All 14 physical pitches match by unique identifier, type, speed and count before the pitch. Source retrieval was October 18, 2026, at about 9:54 p.m. MDT, after the game was final.
The primary pitch comparison is all 977 physical pitches from 65 regular-season appearances, March 28–September 25, 2026. Four automatic balls are excluded. This complete export was originally retrieved October 18 at 12:01 a.m. MDT and reused for this report; every game’s physical-pitch count reconciles with the freshly checked official regular-season log. The 12 pitches from postseason Game 4 on October 17 form a separate previous-outing comparison. Neither postseason outing is mixed into the regular-season baseline.
The chronological scoreless calculation uses MLB’s regular-season log and combined postseason log, cross-checked against each postseason round. It counts appearances with no charged runs, earned or unearned. The 13-appearance span explicitly combines regular season and postseason; the six-appearance October sample is also shown separately. Innings are calculated from integer outs; 13.1 in a baseball box score means 13 innings and one out.
Whiff rate means misses divided by swings. Swings include fouls, balls in play, foul tips and bunt attempts; caught foul tips and missed bunts count as misses under the same mapping in both samples. Strikeouts come from completed plate appearances. Called strikes are counted separately from misses. Hard-hit means a measured exit speed of at least 95 mph. All three Game 5 balls in play have measured exit speed, launch angle and Savant expected batting average; expected wOBA is unavailable and remains blank.
Savant plate coordinates and the recorded batter-specific zone are used for location. The optional zone/chase calculation uses the ball center within the 17-inch plate and recorded vertical boundaries, with no ball-radius expansion; it can differ from an umpire’s call or Savant’s own zone classification. Raw MLB pX/pZ coordinates, which use a slightly different measurement convention, are retained separately in the CSV. A pitch location does not establish its intended target. Speed is mph, spin rpm, extension and plate location feet, and movement inches. Induced vertical break is movement relative to a gravity-only path, not physical rise. Expected batting average is Savant’s contact estimate, not the actual outcome or a prediction for a particular fielder. Statcast field definitions.
One inning, four batters and four fastballs supply a small sample. The comparison supports the measured selection and speed differences; it cannot establish a lasting strategy change, fatigue, injury or an explanation for the velocity readings.
Sources and notes
- Official MLB final Game 849817 and pitching game logs; Baseball Savant complete Game 5 gamefeed and pregame 2026 regular-season export. Definitions, source dates, comparison periods and limitations appear in the article methods.