
MLB · Pitching Data
Drew Rasmussen’s Changeup Turned Contact Into Outs in ALCS Game 5
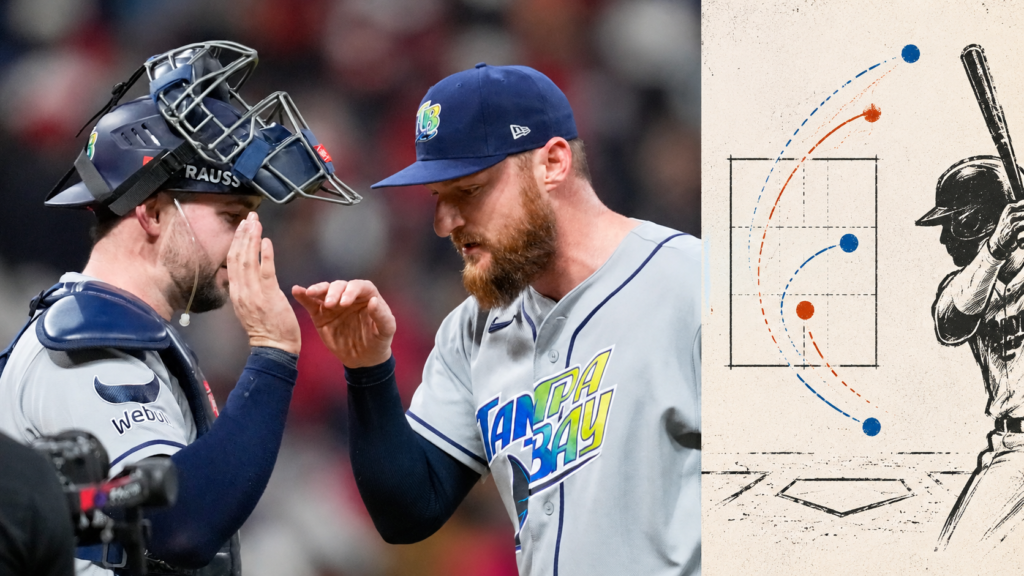
Drew Rasmussen doubled his regular-season changeup share in ALCS Game 5, but its biggest return came on contact. All 95 pitches, three charts and a season and Game 1 comparison explain his seven innings against Cleveland.
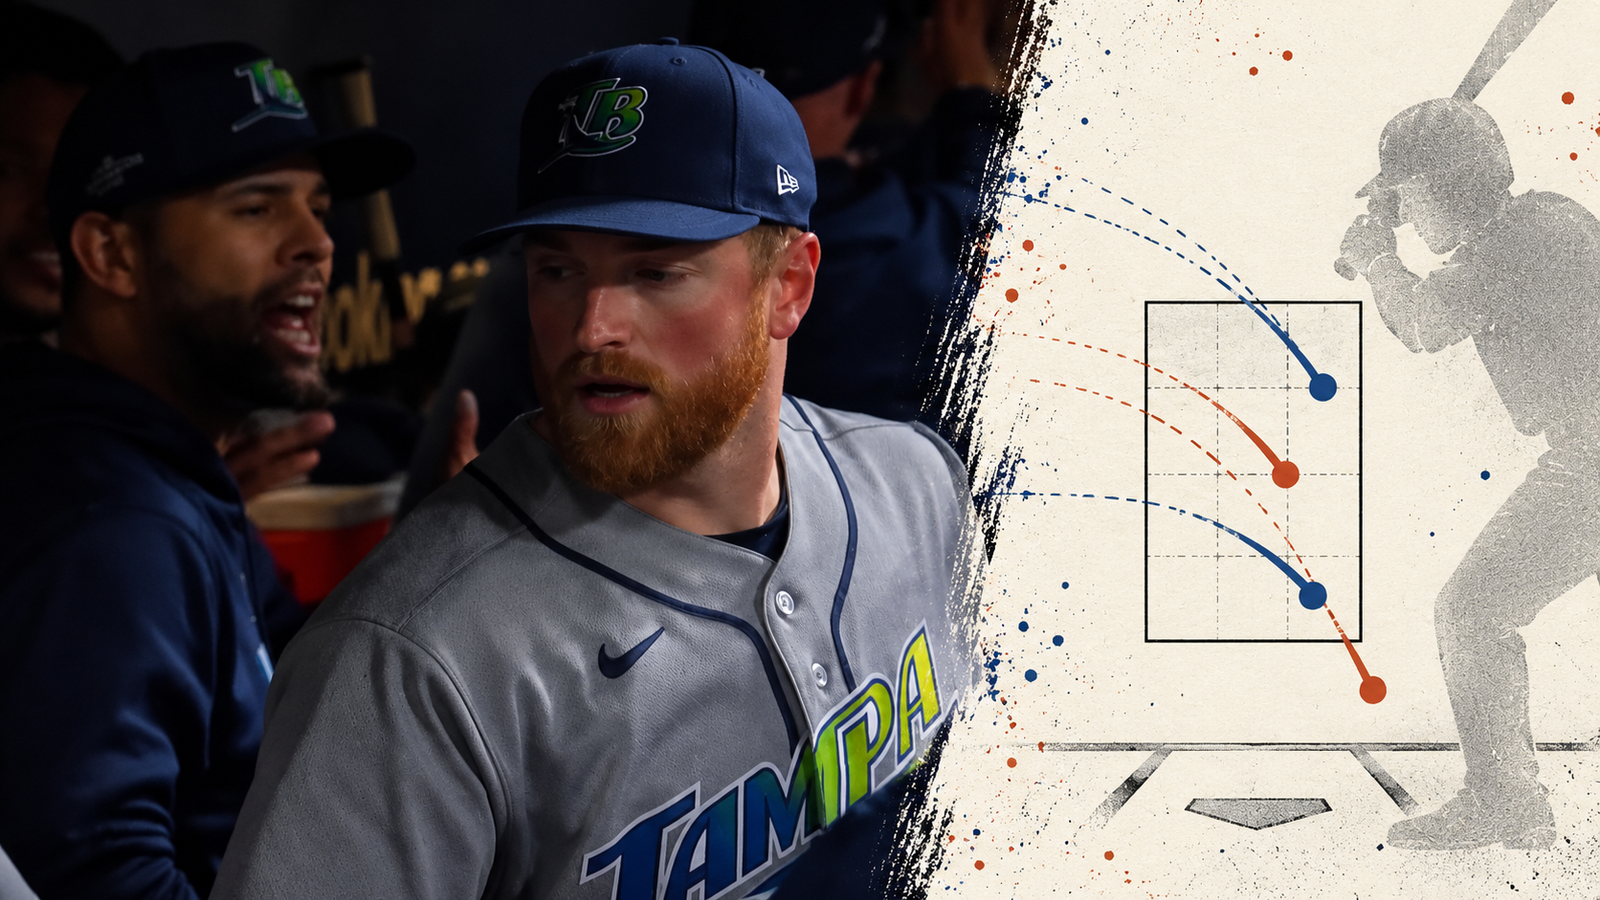
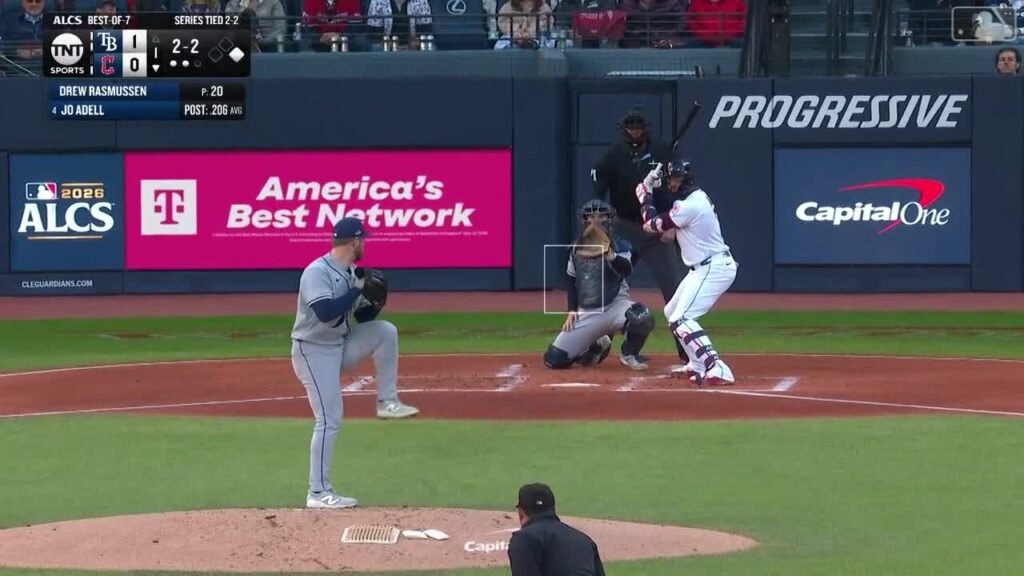
Patrick Bailey had already swung through a changeup below the zone when Drew Rasmussen threw the fastest pitch of his night. The 97.2 mph four-seamer finished just above Bailey’s recorded upper boundary for a ball. Rasmussen followed it with an 89.2 mph changeup near the bottom of the zone, and Bailey grounded into the double play that ended the seventh inning.
That last confrontation captured more than Rasmussen’s six strikeouts. He used a larger share of changeups, gave Cleveland a different speed and height to cover, and turned the contact against that pitch into outs. The changeup finished only one of his strikeouts, but it produced ten balls in play, eight of them grounders, without allowing a hit.
Rasmussen finished with seven innings, four hits, one run and one walk in Tampa Bay’s 3-1 victory over Cleveland in ALCS Game 5 on October 18, 2026, at Progressive Field. His 95 pitches helped move the Rays within one win of the World Series. The complete record supports a change in how often he used an established pitch, with better contact results than his first start in the series, rather than a sudden increase in fastball speed.
A changeup increase that survives the lineup comparison
The full regular-season comparison contains 2,660 physical pitches in 30 starts from March 26 through September 22. Changeups accounted for 354 of them, or 13.3%. In Game 5, Rasmussen threw 27 in 95 pitches, a 28.4% share and an increase of 15.1 percentage points. His sinker share fell from 23.8% to 14.7%, while the cutter fell from 28.9% to 25.3%.
Cleveland’s lineup supplied one plausible explanation. Eighty of Rasmussen’s 95 pitches went to hitters batting left-handed, and every changeup did. The regular-season sample contained a smaller left-handed share. A pitcher facing more hitters on the side against which he normally uses a changeup can increase its overall percentage without changing his approach to either side.
That does not account for all of this increase. Against left-handed hitters alone, Rasmussen went from 285 changeups in 1,606 regular-season pitches, 17.7%, to 27 in 80, 33.8%. His October 12 ALCS Game 1 start offers another useful comparison: 76 of its 91 pitches also went to left-handed hitters, almost the same opponent mix as Game 5, but only 11 of those 76 pitches were changeups, 14.5%.
The added use was not confined to strikeout counts. Rasmussen began seven of his 25 Game 5 plate appearances with changeups, compared with 47 changeups among 671 recorded first pitches during the regular season. He also threw 13 changeups among his 34 two-strike pitches. The pitch was part of establishing counts as well as finishing them.
Different locations, with the fastball still available
Rasmussen’s four-seamer averaged 95.8 mph in Game 5, almost identical to its 95.8 mph regular-season average. The changeup averaged 89.1 mph, giving the two pitches a separation of about 6.7 mph. The useful difference was in the choices they presented, including the low changeup and upper-zone fastball in Bailey’s final at-bat.
Bailey fouled off the opening four-seamer, missed a changeup at 0.710 feet above the ground, then took that 97.2 mph fastball at 3.335 feet. His recorded zone extended from 1.627 to 3.224 feet. The last changeup crossed at 1.787 feet and left his bat at 80.8 mph. The locations establish what Bailey had to cover; they do not reveal Rasmussen’s intended target or prove how early Bailey recognized either pitch.
The broader location record was more varied than four pitches. Twelve of 27 changeups were classified inside the tracking zone, while hitters swung at nine of the 15 outside it. That 9-for-15 chase count is useful evidence of pitches drawing decisions beyond the zone, but the pitch also got two called strikes and several grounders on swings inside it.
In his postgame news conference, Rasmussen said the Rays had wanted a similar plan in Game 1, but the changeup’s movement and command had not been there. In Game 5, he said, it gave him more opportunity to attack alongside his cutter. The comparison fits increased reliance on the pitch, rather than evidence that he invented a new plan between starts.
The main return was contact, not an exceptional whiff rate
The changeup generated five misses in 19 swings, a 26.3% whiff rate. That was better than one miss in nine swings in Game 1, but below its regular-season 66 in 187, or 35.3%. More changeups did not produce a higher miss rate than his season norm. The four-seamer finished three of Rasmussen’s six strikeouts and the cutter finished two.
The contact against the changeup averaged 80.6 mph across ten measured balls in play. Eight were grounders, with Kwan’s first-inning foul flyout and Travis Bazzana’s seventh-inning popup accounting for the others. Across the whole outing, Cleveland put 18 balls in play with an average exit velocity of 84.4 mph, compared with 94.3 mph on 18 balls in play in Game 1. Three of the Game 5 balls reached the 95 mph hard-hit threshold, compared with nine in Game 1.
The zero-hit changeup result still benefited from what happened after contact. José Ramírez hit one 96.6 mph grounder that became an out. Baseball Savant’s expected batting averages for all ten changeup balls in play sum to approximately 1.67 expected hits, compared with the actual zero. That calculation adds rounded per-ball estimates and is not an official aggregate statistic. It cautions against treating ten outs as a repeatable hit-suppression rate, even though most of this contact was modest.
Cleveland also found a route back into the game against the cutter. Kwan and Ramírez singled off it in the sixth, putting runners at the corners. A changeup groundout by Chase DeLauter brought home Kwan, then Rasmussen got Jo Adell to pop out and strand Ramírez. Three of the four hits he allowed came on cutters, a useful limit on describing the entire repertoire as equally difficult to hit.
Enough speed remained for the last inning
Rasmussen needed 21 pitches in the first, but only 19 combined in the next two innings. He entered the seventh at 83 pitches and finished it in 12, recovering after Nathaniel Lowe’s leadoff single. Bazzana’s seven-pitch popup extended the inning before Bailey’s double play ended it.
His four-seam averages were lower in the fifth and sixth than in the second, but the seventh-inning average returned to 95.9 mph across four pitches, and pitch 94 was his fastest of the night. The inning samples range from three to six four-seamers. They show why a simple downward fatigue narrative would miss the finish; they cannot establish his physical condition.
The next test is whether Rasmussen keeps using the changeup this often against left-handed hitters, and whether it continues to produce useful contact when some grounders find holes. Game 5 supplied evidence of a broader role for the pitch within his existing repertoire. Its contribution was visible in the counts he started, the swings below the zone and the double play that let him hand over a two-run lead after seven.
Explore all 95 pitches
Filter the complete physical-pitch record. The count is before each pitch. Pitch result and plate-appearance result are separate. Select a pitch number for its measurements.
95 of 95 pitches
No pitches match these filters.
| Pitch | Inning | Hitter | Count before | Type | mph | Pitch result | PA result |
|---|---|---|---|---|---|---|---|
| 1 | Steven Kwan | 0-0 | Four-Seam Fastball | 94.8 | Ball | Flyout | |
| 1 | Steven Kwan | 1-0 | Four-Seam Fastball | 94.6 | Called Strike | Flyout | |
| 1 | Steven Kwan | 1-1 | Cutter | 90.5 | Ball | Flyout | |
| 1 | Steven Kwan | 2-1 | Sinker | 93.9 | Foul | Flyout | |
| 1 | Steven Kwan | 2-2 | Cutter | 89.6 | Foul | Flyout | |
| 1 | Steven Kwan | 2-2 | Changeup | 88.4 | Foul | Flyout | |
| 1 | Steven Kwan | 2-2 | Changeup | 88.3 | In play, out(s) | Flyout | |
| 1 | José Ramírez | 0-0 | Sinker | 94.9 | Ball | Groundout | |
| 1 | José Ramírez | 1-0 | Cutter | 91.0 | Foul | Groundout | |
| 1 | José Ramírez | 1-1 | Changeup | 88.8 | Ball | Groundout | |
| 1 | José Ramírez | 2-1 | Four-Seam Fastball | 95.7 | Foul | Groundout | |
| 1 | José Ramírez | 2-2 | Sinker | 96.2 | In play, out(s) | Groundout | |
| 1 | Chase DeLauter | 0-0 | Cutter | 91.0 | Foul | Single | |
| 1 | Chase DeLauter | 0-1 | Four-Seam Fastball | 96.2 | Foul | Single | |
| 1 | Chase DeLauter | 0-2 | Changeup | 90.2 | Ball | Single | |
| 1 | Chase DeLauter | 1-2 | Cutter | 91.0 | In play, no out | Single | |
| 1 | Jo Adell | 0-0 | Sinker | 95.6 | Foul Tip | Strikeout | |
| 1 | Jo Adell | 0-1 | Cutter | 89.4 | Ball | Strikeout | |
| 1 | Jo Adell | 1-1 | Sinker | 96.5 | Ball | Strikeout | |
| 1 | Jo Adell | 2-1 | Four-Seam Fastball | 96.4 | Swinging Strike | Strikeout | |
| 1 | Jo Adell | 2-2 | Four-Seam Fastball | 96.9 | Swinging Strike | Strikeout | |
| 2 | Nathaniel Lowe | 0-0 | Changeup | 87.3 | Called Strike | Strikeout | |
| 2 | Nathaniel Lowe | 0-1 | Cutter | 89.5 | Foul | Strikeout | |
| 2 | Nathaniel Lowe | 0-2 | Four-Seam Fastball | 96.5 | Ball | Strikeout | |
| 2 | Nathaniel Lowe | 1-2 | Cutter | 90.4 | Swinging Strike | Strikeout | |
| 2 | Travis Bazzana | 0-0 | Cutter | 90.3 | Called Strike | Strikeout | |
| 2 | Travis Bazzana | 0-1 | Changeup | 90.1 | Ball | Strikeout | |
| 2 | Travis Bazzana | 1-1 | Four-Seam Fastball | 96.6 | Called Strike | Strikeout | |
| 2 | Travis Bazzana | 1-2 | Sinker | 95.8 | Foul | Strikeout | |
| 2 | Travis Bazzana | 1-2 | Changeup | 89.8 | Foul | Strikeout | |
| 2 | Travis Bazzana | 1-2 | Four-Seam Fastball | 96.2 | Ball | Strikeout | |
| 2 | Travis Bazzana | 2-2 | Cutter | 90.2 | Swinging Strike | Strikeout | |
| 2 | Patrick Bailey | 0-0 | Changeup | 89.7 | In play, out(s) | Groundout | |
| 3 | Petey Halpin | 0-0 | Sinker | 94.4 | Swinging Strike | Strikeout | |
| 3 | Petey Halpin | 0-1 | Cutter | 90.1 | Swinging Strike | Strikeout | |
| 3 | Petey Halpin | 0-2 | Four-Seam Fastball | 96.5 | Swinging Strike | Strikeout | |
| 3 | Brayan Rocchio | 0-0 | Four-Seam Fastball | 96.5 | Foul | Groundout | |
| 3 | Brayan Rocchio | 0-1 | Changeup | 90.2 | In play, out(s) | Groundout | |
| 3 | Steven Kwan | 0-0 | Four-Seam Fastball | 95.4 | Called Strike | Groundout | |
| 3 | Steven Kwan | 0-1 | Changeup | 89.5 | In play, out(s) | Groundout | |
| 4 | José Ramírez | 0-0 | Changeup | 88.4 | Called Strike | Groundout | |
| 4 | José Ramírez | 0-1 | Four-Seam Fastball | 95.4 | Called Strike | Groundout | |
| 4 | José Ramírez | 0-2 | Cutter | 91.7 | Foul | Groundout | |
| 4 | José Ramírez | 0-2 | Four-Seam Fastball | 95.2 | Ball | Groundout | |
| 4 | José Ramírez | 1-2 | Changeup | 89.4 | In play, out(s) | Groundout | |
| 4 | Chase DeLauter | 0-0 | Sinker | 94.2 | In play, out(s) | Groundout | |
| 4 | Jo Adell | 0-0 | Four-Seam Fastball | 95.9 | Foul | Walk | |
| 4 | Jo Adell | 0-1 | Cutter | 88.2 | Swinging Strike | Walk | |
| 4 | Jo Adell | 0-2 | Four-Seam Fastball | 96.0 | Ball | Walk | |
| 4 | Jo Adell | 1-2 | Sinker | 95.5 | Ball | Walk | |
| 4 | Jo Adell | 2-2 | Sinker | 96.3 | Ball | Walk | |
| 4 | Jo Adell | 3-2 | Four-Seam Fastball | 96.7 | Ball | Walk | |
| 4 | Nathaniel Lowe | 0-0 | Sinker | 95.2 | Ball | Strikeout | |
| 4 | Nathaniel Lowe | 1-0 | Cutter | 89.9 | Foul | Strikeout | |
| 4 | Nathaniel Lowe | 1-1 | Changeup | 89.9 | Swinging Strike | Strikeout | |
| 4 | Nathaniel Lowe | 1-2 | Four-Seam Fastball | 96.8 | Foul Tip | Strikeout | |
| 5 | Travis Bazzana | 0-0 | Curveball | 78.9 | Ball | Strikeout | |
| 5 | Travis Bazzana | 1-0 | Cutter | 89.7 | Foul | Strikeout | |
| 5 | Travis Bazzana | 1-1 | Four-Seam Fastball | 95.0 | Foul | Strikeout | |
| 5 | Travis Bazzana | 1-2 | Changeup | 87.9 | Swinging Strike | Strikeout | |
| 5 | Patrick Bailey | 0-0 | Sinker | 94.9 | Ball | Groundout | |
| 5 | Patrick Bailey | 1-0 | Cutter | 90.7 | Foul | Groundout | |
| 5 | Patrick Bailey | 1-1 | Four-Seam Fastball | 95.3 | Foul | Groundout | |
| 5 | Patrick Bailey | 1-2 | Changeup | 89.3 | In play, out(s) | Groundout | |
| 5 | Petey Halpin | 0-0 | Changeup | 90.1 | Swinging Strike | Groundout | |
| 5 | Petey Halpin | 0-1 | Four-Seam Fastball | 95.0 | Ball | Groundout | |
| 5 | Petey Halpin | 1-1 | Changeup | 89.0 | Ball | Groundout | |
| 5 | Petey Halpin | 2-1 | Cutter | 89.7 | Called Strike | Groundout | |
| 5 | Petey Halpin | 2-2 | Four-Seam Fastball | 95.8 | Foul | Groundout | |
| 5 | Petey Halpin | 2-2 | Changeup | 88.8 | In play, out(s) | Groundout | |
| 6 | Brayan Rocchio | 0-0 | Sinker | 94.6 | In play, out(s) | Lineout | |
| 6 | Steven Kwan | 0-0 | Changeup | 87.1 | Ball | Single | |
| 6 | Steven Kwan | 1-0 | Four-Seam Fastball | 94.3 | Called Strike | Single | |
| 6 | Steven Kwan | 1-1 | Cutter | 88.9 | In play, no out | Single | |
| 6 | José Ramírez | 0-0 | Cutter | 90.4 | In play, no out | Single | |
| 6 | Chase DeLauter | 0-0 | Changeup | 89.5 | Foul | Groundout | |
| 6 | Chase DeLauter | 0-1 | Four-Seam Fastball | 95.5 | Ball | Groundout | |
| 6 | Chase DeLauter | 1-1 | Cutter | 90.1 | Foul | Groundout | |
| 6 | Chase DeLauter | 1-2 | Changeup | 89.7 | In play, run(s) | Groundout | |
| 6 | Jo Adell | 0-0 | Cutter | 90.4 | Ball | Pop Out | |
| 6 | Jo Adell | 1-0 | Cutter | 87.9 | Called Strike | Pop Out | |
| 6 | Jo Adell | 1-1 | Four-Seam Fastball | 96.3 | Ball | Pop Out | |
| 6 | Jo Adell | 2-1 | Cutter | 90.4 | In play, out(s) | Pop Out | |
| 7 | Nathaniel Lowe | 0-0 | Four-Seam Fastball | 94.8 | In play, no out | Single | |
| 7 | Travis Bazzana | 0-0 | Changeup | 88.2 | Swinging Strike | Pop Out | |
| 7 | Travis Bazzana | 0-1 | Four-Seam Fastball | 95.2 | Foul | Pop Out | |
| 7 | Travis Bazzana | 0-2 | Changeup | 89.2 | Ball | Pop Out | |
| 7 | Travis Bazzana | 1-2 | Sinker | 95.0 | Foul | Pop Out | |
| 7 | Travis Bazzana | 1-2 | Changeup | 88.9 | Foul | Pop Out | |
| 7 | Travis Bazzana | 1-2 | Cutter | 90.4 | Foul | Pop Out | |
| 7 | Travis Bazzana | 1-2 | Changeup | 89.2 | In play, out(s) | Pop Out | |
| 7 | Patrick Bailey | 0-0 | Four-Seam Fastball | 96.2 | Foul | Grounded Into DP | |
| 7 | Patrick Bailey | 0-1 | Changeup | 89.9 | Swinging Strike (Blocked) | Grounded Into DP | |
| 7 | Patrick Bailey | 0-2 | Four-Seam Fastball | 97.2 | Ball | Grounded Into DP | |
| 7 | Patrick Bailey | 1-2 | Changeup | 89.2 | In play, out(s) | Grounded Into DP |
Sources, definitions and limitations
The official MLB final game record supplies sequence, calls, results and pitching totals. Baseball Savant’s Game 5 record supplies independently reconciled pitch tracking and expected contact outcomes. Both were freshly retrieved after the game was final on October 18, 2026, Mountain Time. The 95 unique physical-pitch IDs, types, count before each pitch and release speeds reconcile between the sources. All pitches have speed, spin, extension, movement, plate location and batter-zone measurements; all 18 balls in play have measured exit velocity, launch angle and Savant expected batting average. Missing contact fields on non-contact pitches remain blank rather than zero.
The regular-season comparison contains all 2,660 physical pitches from 30 starts, March 26 through September 22, 2026, retrieved from Baseball Savant Statcast Search. No nonphysical events required exclusion. All 30 game identifiers and each game’s pitch count reconcile with the official 2026 regular-season log. Postseason games and the target outing are excluded. The separate Game 1 comparison is October 12, game 849820, with 91 reconciled physical pitches and 25 batters faced.
Whiff rate is misses divided by nonbunt swings. This paper follows Savant’s game-summary convention by counting caught foul tips as misses; ordinary fouls and balls in play count as swings, and bunt attempts are excluded from swing/miss rates. The Game 5 total is 15 misses in 59 swings, matching Savant’s summary; counting only swings with no contact would yield 13, a different definition. The same convention is used for the regular season and Game 1. Called strikes are reported separately.
Tracking zone codes 1-9 define inside-zone pitches, with other valid codes outside. Chase rate is nonbunt swings outside divided by outside-zone physical pitches with valid location classification. Diagram coordinates use MLB’s plate-position fields consistently; Savant’s slightly different plate coordinates remain separately in the CSV. These describe locations, not intended targets. Induced vertical break is inches of deviation from a gravity-only trajectory and does not mean that a pitch rises; regular-season Statcast pfx_z values are converted from feet to inches. Horizontal break retains MLB’s supplied convention and is not compared with a differently signed baseline.
Speed is mph; spin rpm; extension and plate location feet. Hard-hit means exit velocity of at least 95 mph. Savant’s expected batting average is a model estimate for a ball in play, not an actual result; adding its rounded estimates is approximate. Innings are reconciled from integer outs, and the outing has 21 outs. A single game cannot establish hitter expectations, fatigue, injury or repeatability. Statcast field definitions.
Sources and notes
- Official MLB final Game 849817 and pitching game logs; Baseball Savant complete Game 5 gamefeed and pregame 2026 regular-season export. Definitions, source dates, comparison periods and limitations appear in the article methods.