
MLB · Pitching Data
Nick Martinez’s Changeup Anchored a Different Mix in ALCS Game 4
The Rays starter reduced his sinker use, collected 16 called strikes and held Cleveland to one run. His 79-pitch record also shows where defense and relief support helped.
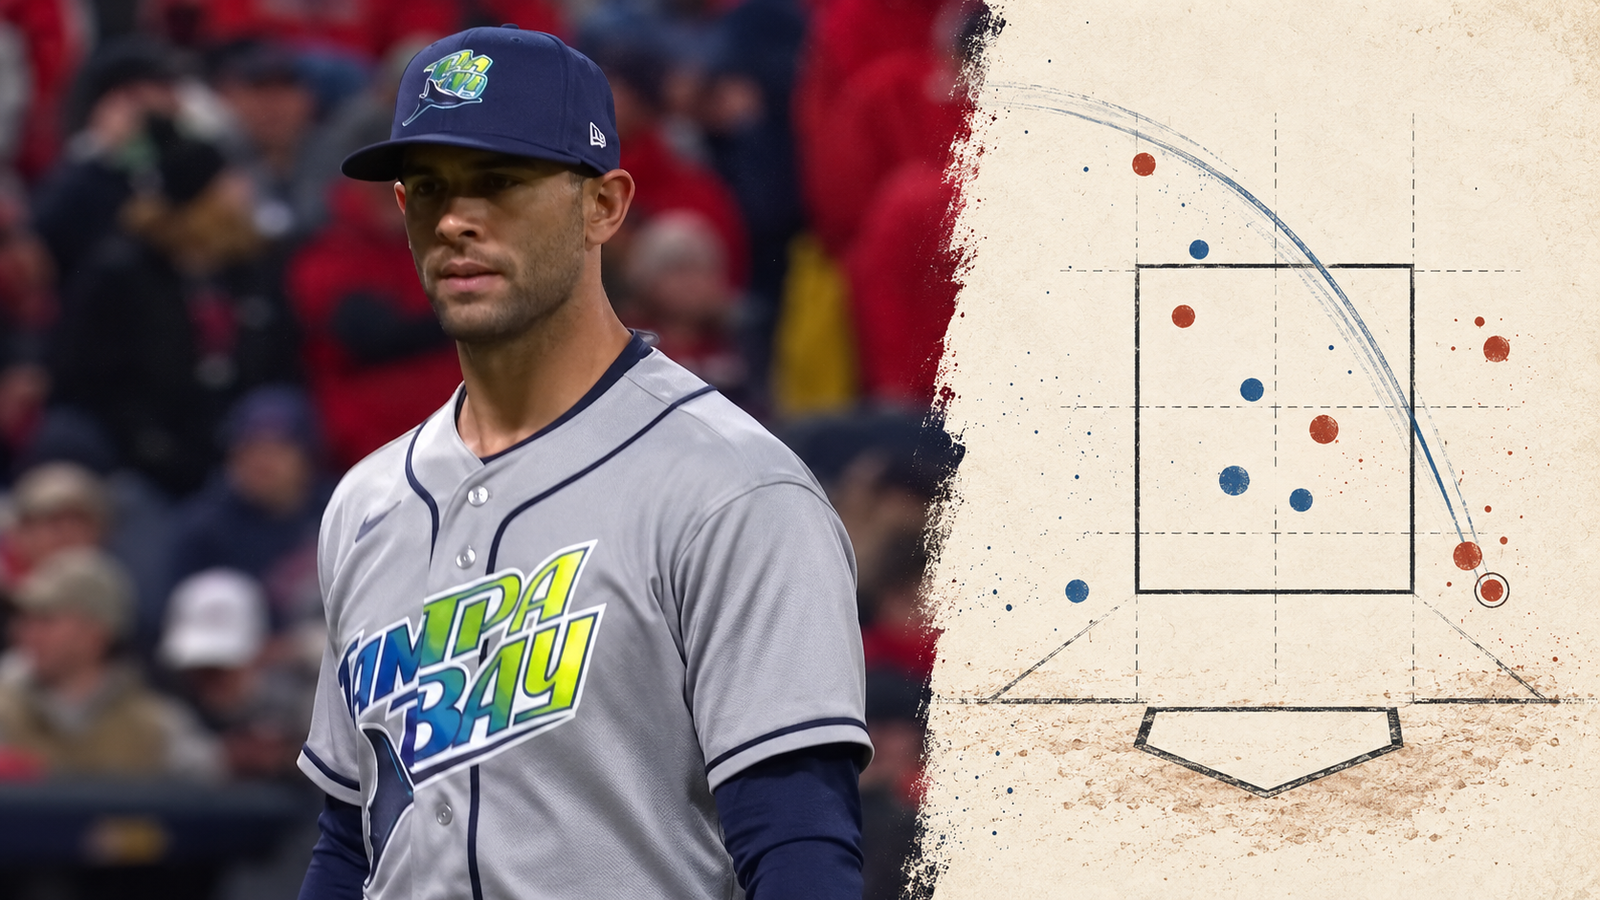
Travis Bazzana watched a 77.7 mph changeup become strike one. After a cutter missed high, another changeup, this one at 77.8, gave Nick Martinez strike two. The finish was different: a 94.2 mph four-seam fastball above Bazzana’s recorded strike zone and a swing through it.
The second-inning strikeout showed how Martinez could move through Cleveland without a large strikeout total. He allowed one run in 5⅓ innings Saturday at Progressive Field, helping Tampa Bay win ALCS Game 4 7-3 and tie the series at two games each. His line included two hits, two walks and three strikeouts on 79 pitches.
The changeup led his five-pitch mix, but its importance extended beyond how often he threw it. Martinez sharply reduced his sinker from its regular-season share, used more four-seamers and sliders, and obtained twice as many called strikes as misses. His changeup earned strikes on takes and kept contact soft. Those were useful paths through a lineup that still struck several other pitches hard.
The sinker reduction survived a fairer comparison
Martinez threw seven sinkers, 8.9% of his pitches, against a regular-season share of 31.7%. His four-seamer increased from 12.6% to 22.8% and his slider from 3.8% to 11.4%. The changeup rose more modestly, from 25.8% to 29.1%, with 23 pitches. His 22 cutters supplied another 27.8% of the outing.
The comparison uses all 2,524 physical pitches from his 31 regular-season starts, March 30 through September 27. Postseason appearances stay separate. Cleveland’s actual batting sides also matter: 16 of the 18 hitters he faced batted left-handed, accounting for 73 of 79 pitches. His regular-season left-handed share had been 58.9%.
Even within the left-handed group, the sinker reduction was substantial: four of 73 pitches Saturday, 5.5%, against 26.4% across 1,487 regular-season pitches. His four-seamer and slider shares also increased within that group. The changeup was much closer to its established left-handed use, 30.1% against 28.9%. This was a familiar pitch doing important work alongside a different selection of fastballs and breaking balls.
Strikes on takes, outs on contact
Martinez’s changeup produced five called strikes and four misses in 12 swings. Its four balls in play became four outs at exit speeds of 83.1, 42.2, 66.4 and 70.9 mph, an average of 65.7. Those results gave him strikes without swings and outs without strikeouts.
The slider’s role was especially concentrated. Seven of his nine sliders opened an at-bat: five were taken for strikes, one drew a miss and one was a ball. Overall, the pitch delivered five called strikes and one miss. One swing cannot establish a meaningful slider whiff trend; the taken strikes supplied its value here.
Martinez opened 12 of 18 plate appearances with a strike or contact result. He recorded 16 called strikes and eight misses in 37 nonbunt swings. His 53 official strikes also include fouls and balls in play, so that total answers a different question from how often Cleveland swung through a pitch.
His four-seamer averaged 93.5 mph and the changeup 77.7, a 15.8 mph gap. Average induced vertical break was 17.8 inches for the four-seamer and 2.5 for the changeup. That measure removes gravity’s effect; it does not mean the ball physically rises. The averages establish different speed and movement profiles without proving the pitches followed the same path or revealing what hitters expected.
Four pitches, two different finishes
With two outs in the fourth, Jo Adell took an 89.5 mph cutter for strike one, then fouled off a 92.7 mph sinker and a 93.0 mph four-seamer. At 0-2, Martinez’s 77.6 mph changeup finished below the recorded zone. Adell missed it for a blocked swinging strike, ending the inning.
The final pitch was 15.4 mph slower than the previous one. Four consecutive pitches came from four classifications. Bazzana’s strikeout had ended on a high fastball; Adell’s ended below the zone. The sequences show contrasting finishes after Martinez acquired earlier strikes. They cannot establish that every pitch reached an intended catcher target.
Hard contact and relief support belong in the line
The first inning was less comfortable than two hits over 5⅓ innings might suggest. Steven Kwan singled, advanced on a wild pitch and scored on Chase DeLauter’s 109.1 mph single. Victor Mesa Jr. threw DeLauter out trying for second. Adell followed with a 106.8 mph flyout to left. Both hard-hit balls came against sinkers.
Martinez allowed no more hits. Still, Patrick Bailey hit a fifth-inning cutter at 102.1 mph and grounded into a double play after Bazzana walked. The two outs were valuable, yet the contact was hard. Cleveland’s 13 balls in play averaged 81.9 mph, with three reaching the 95 mph hard-hit threshold. The displayed Statcast hit probabilities sum to approximately 3.81 expected hits on contact, compared with two actual hits. That calculation uses rounded per-ball estimates rather than an official aggregate statistic, but it reinforces the contribution of favorable contact outcomes.
After a 22-pitch first inning, each of the next four required between 11 and 13, putting Martinez at 71 through five. He walked Petey Halpin to open the sixth, retired Brayan Rocchio and departed with Tampa Bay leading 2-1. Freddy Peralta stranded Halpin, getting two outs around a José Ramírez walk. Martinez’s one-run line includes relief support at a consequential moment.
His four-seamer averaged 94.1 mph in the first and 93.2 in the partial sixth, with only three measured pitches in each. Those small samples do not diagnose fatigue. His last two innings included both walks, even as he kept Cleveland hitless.
The question for his next outing is whether the changeup can retain its taken strikes and soft contact against a lineup with more right-handed opportunities. Game 4 supplied several ways to reach an out, while its early hard contact and late walks showed why the result still needed help.
Explore all 79 pitches
Filter the complete physical-pitch record. Count is before each pitch. Pitch result and plate-appearance result are separate. Select a pitch number for its measurements.
79 of 79 pitches
No pitches match these filters.
| Pitch | Inning | Hitter | Count before | Type | mph | Pitch result | PA result |
|---|---|---|---|---|---|---|---|
| 1 | Steven Kwan | 0–0 | Four-Seam Fastball | 94.0 | Ball | Single | |
| 1 | Steven Kwan | 1–0 | Four-Seam Fastball | 94.2 | Called Strike | Single | |
| 1 | Steven Kwan | 1–1 | Slider | 85.8 | Ball | Single | |
| 1 | Steven Kwan | 2–1 | Sinker | 93.8 | Called Strike | Single | |
| 1 | Steven Kwan | 2–2 | Cutter | 90.9 | Ball | Single | |
| 1 | Steven Kwan | 3–2 | Sinker | 93.7 | In play, no out | Single | |
| 1 | José Ramírez | 0–0 | Slider | 85.1 | Called Strike | Pop Out | |
| 1 | José Ramírez | 0–1 | Cutter | 90.1 | Ball | Pop Out | |
| 1 | José Ramírez | 1–1 | Changeup | 78.5 | Ball | Pop Out | |
| 1 | José Ramírez | 2–1 | Cutter | 90.4 | Foul | Pop Out | |
| 1 | José Ramírez | 2–2 | Changeup | 78.3 | In play, out(s) | Pop Out | |
| 1 | Chase DeLauter | 0–0 | Slider | 85.8 | Called Strike | Single | |
| 1 | Chase DeLauter | 0–1 | Cutter | 89.5 | Foul | Single | |
| 1 | Chase DeLauter | 0–2 | Four-Seam Fastball | 94.1 | Foul | Single | |
| 1 | Chase DeLauter | 0–2 | Sinker | 93.4 | Ball | Single | |
| 1 | Chase DeLauter | 1–2 | Changeup | 78.9 | Foul | Single | |
| 1 | Chase DeLauter | 1–2 | Cutter | 90.2 | Foul | Single | |
| 1 | Chase DeLauter | 1–2 | Changeup | 78.8 | Ball In Dirt | Single | |
| 1 | Chase DeLauter | 2–2 | Slider | 86.2 | Ball In Dirt | Single | |
| 1 | Chase DeLauter | 3–2 | Sinker | 94.1 | In play, run(s) | Single | |
| 1 | Jo Adell | 0–0 | Sinker | 93.4 | Called Strike | Flyout | |
| 1 | Jo Adell | 0–1 | Sinker | 92.3 | In play, out(s) | Flyout | |
| 2 | Nathaniel Lowe | 0–0 | Slider | 84.1 | Called Strike | Groundout | |
| 2 | Nathaniel Lowe | 0–1 | Four-Seam Fastball | 93.0 | Swinging Strike | Groundout | |
| 2 | Nathaniel Lowe | 0–2 | Changeup | 78.8 | In play, out(s) | Groundout | |
| 2 | Travis Bazzana | 0–0 | Changeup | 77.7 | Called Strike | Strikeout | |
| 2 | Travis Bazzana | 0–1 | Cutter | 89.5 | Ball | Strikeout | |
| 2 | Travis Bazzana | 1–1 | Changeup | 77.8 | Called Strike | Strikeout | |
| 2 | Travis Bazzana | 1–2 | Four-Seam Fastball | 94.2 | Swinging Strike | Strikeout | |
| 2 | Patrick Bailey | 0–0 | Slider | 84.6 | Swinging Strike | Groundout | |
| 2 | Patrick Bailey | 0–1 | Changeup | 78.3 | Swinging Strike | Groundout | |
| 2 | Patrick Bailey | 0–2 | Changeup | 77.7 | Ball | Groundout | |
| 2 | Patrick Bailey | 1–2 | Four-Seam Fastball | 93.0 | Ball | Groundout | |
| 2 | Patrick Bailey | 2–2 | Changeup | 77.2 | Foul | Groundout | |
| 2 | Patrick Bailey | 2–2 | Cutter | 89.9 | In play, out(s) | Groundout | |
| 3 | Petey Halpin | 0–0 | Cutter | 89.2 | Foul | Groundout | |
| 3 | Petey Halpin | 0–1 | Changeup | 77.4 | Foul | Groundout | |
| 3 | Petey Halpin | 0–2 | Four-Seam Fastball | 93.3 | In play, out(s) | Groundout | |
| 3 | Brayan Rocchio | 0–0 | Slider | 85.6 | Called Strike | Strikeout | |
| 3 | Brayan Rocchio | 0–1 | Four-Seam Fastball | 92.5 | Ball | Strikeout | |
| 3 | Brayan Rocchio | 1–1 | Cutter | 89.3 | Foul | Strikeout | |
| 3 | Brayan Rocchio | 1–2 | Four-Seam Fastball | 93.7 | Foul | Strikeout | |
| 3 | Brayan Rocchio | 1–2 | Changeup | 79.0 | Swinging Strike | Strikeout | |
| 3 | Steven Kwan | 0–0 | Cutter | 90.6 | Ball | Flyout | |
| 3 | Steven Kwan | 1–0 | Four-Seam Fastball | 93.3 | Foul | Flyout | |
| 3 | Steven Kwan | 1–1 | Cutter | 90.2 | Foul | Flyout | |
| 3 | Steven Kwan | 1–2 | Changeup | 78.1 | Foul | Flyout | |
| 3 | Steven Kwan | 1–2 | Cutter | 89.3 | In play, out(s) | Flyout | |
| 4 | José Ramírez | 0–0 | Changeup | 78.3 | Called Strike | Groundout | |
| 4 | José Ramírez | 0–1 | Cutter | 89.7 | Called Strike | Groundout | |
| 4 | José Ramírez | 0–2 | Four-Seam Fastball | 93.8 | Foul | Groundout | |
| 4 | José Ramírez | 0–2 | Changeup | 76.9 | In play, out(s) | Groundout | |
| 4 | Chase DeLauter | 0–0 | Changeup | 77.9 | Called Strike | Pop Out | |
| 4 | Chase DeLauter | 0–1 | Four-Seam Fastball | 93.9 | Ball | Pop Out | |
| 4 | Chase DeLauter | 1–1 | Cutter | 89.4 | Swinging Strike | Pop Out | |
| 4 | Chase DeLauter | 1–2 | Changeup | 76.2 | In play, out(s) | Pop Out | |
| 4 | Jo Adell | 0–0 | Cutter | 89.5 | Called Strike | Strikeout | |
| 4 | Jo Adell | 0–1 | Sinker | 92.7 | Foul | Strikeout | |
| 4 | Jo Adell | 0–2 | Four-Seam Fastball | 93.0 | Foul | Strikeout | |
| 4 | Jo Adell | 0–2 | Changeup | 77.6 | Swinging Strike (Blocked) | Strikeout | |
| 5 | Nathaniel Lowe | 0–0 | Four-Seam Fastball | 93.3 | Ball | Flyout | |
| 5 | Nathaniel Lowe | 1–0 | Changeup | 77.5 | Swinging Strike | Flyout | |
| 5 | Nathaniel Lowe | 1–1 | Cutter | 90.5 | In play, out(s) | Flyout | |
| 5 | Travis Bazzana | 0–0 | Slider | 83.5 | Ball | Walk | |
| 5 | Travis Bazzana | 1–0 | Changeup | 77.5 | Called Strike | Walk | |
| 5 | Travis Bazzana | 1–1 | Cutter | 89.0 | Ball | Walk | |
| 5 | Travis Bazzana | 2–1 | Four-Seam Fastball | 93.7 | Ball | Walk | |
| 5 | Travis Bazzana | 3–1 | Cutter | 90.1 | Ball | Walk | |
| 5 | Patrick Bailey | 0–0 | Cutter | 90.3 | Ball | Grounded Into DP | |
| 5 | Patrick Bailey | 1–0 | Changeup | 76.2 | Ball | Grounded Into DP | |
| 5 | Patrick Bailey | 2–0 | Cutter | 90.0 | In play, out(s) | Grounded Into DP | |
| 6 | Petey Halpin | 0–0 | Changeup | 76.1 | Ball | Walk | |
| 6 | Petey Halpin | 1–0 | Cutter | 89.7 | Ball | Walk | |
| 6 | Petey Halpin | 2–0 | Four-Seam Fastball | 93.3 | Ball | Walk | |
| 6 | Petey Halpin | 3–0 | Four-Seam Fastball | 92.6 | Called Strike | Walk | |
| 6 | Petey Halpin | 3–1 | Cutter | 89.1 | Ball | Walk | |
| 6 | Brayan Rocchio | 0–0 | Slider | 83.0 | Called Strike | Flyout | |
| 6 | Brayan Rocchio | 0–1 | Changeup | 75.9 | Ball | Flyout | |
| 6 | Brayan Rocchio | 1–1 | Four-Seam Fastball | 93.7 | In play, out(s) | Flyout |
Sources, definitions and limitations
The official MLB final game record supplies calls, sequence, pitching lines and outs. Baseball Savant’s complete gamefeed supplies reconciled tracking, and Statcast Search supplies the regular-season comparison. Source retrieval: October 18, 2026, 12:01 a.m. MDT, after Game 4 was final. The target outing is October 17.
The complete 79-pitch record reconciles physical pitch IDs, classifications, count before each pitch, batters and strikeouts with MLB and Savant. Automatic calls and other nonpitch events are excluded from physical pitch totals and retained in the private event audit. All outing pitches have speed, spin, extension, induced vertical break and plate coordinates; all balls in play have measured exit speed and launch angle. Missing contact and expected-outcome measurements remain blank rather than zero.
The primary comparison contains 2,524 physical pitches in 31 regular-season starts, March 30–September 27, 2026. One automatic ball is excluded; two physical pitchouts remain. It excludes postseason games and the target outing. Per-game physical pitch totals reconcile to the official regular-season game log. The same definitions are used within each paper’s outing and baseline calculations.
The Martinez location diagram and pitch detail use MLB pX/pZ coordinates and recorded batter-specific zone boundaries. Source zone codes 1–9 define inside-zone counts; nonbunt swings supply the whiff denominator. The two sources’ plate-coordinate fields differ slightly; raw fields are retained separately. A recorded location is not proof of an intended target. Whiff rate means misses divided by defined swings. Called strikes are separate from misses. Hard-hit means exit velocity of at least 95 mph. Induced vertical break is inches relative to a gravity-only path, not physical rise. Speed is mph, spin rpm, extension and plate location feet. Expected batting average is Savant’s estimate, not an actual result. Statcast field definitions.
Innings are calculated from integer outs; .1 means one out and .2 means two. Small samples cannot establish intent, fatigue, injury or future performance.
Sources and notes
- Official MLB final Game 849816 and pitching game logs; Baseball Savant complete gamefeed and pregame 2026 regular-season export. Definitions, periods and limitations in article methods.