
MLB · Pitching Data
Justin Wrobleski, Pitch by Pitch: NLCS Game 3 Analysis
Wrobleski struck out his first three hitters, but a wild pitch scored an inherited runner and a ninth-inning single added a run of his own. His 32 pitches explain the difference.
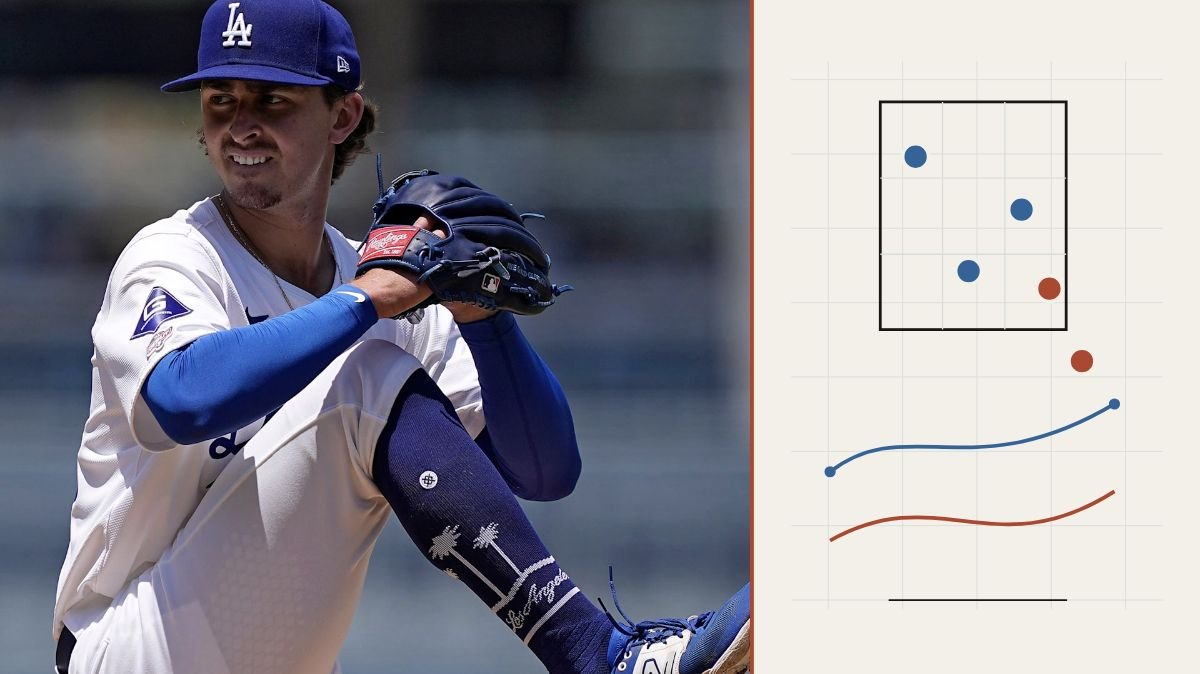
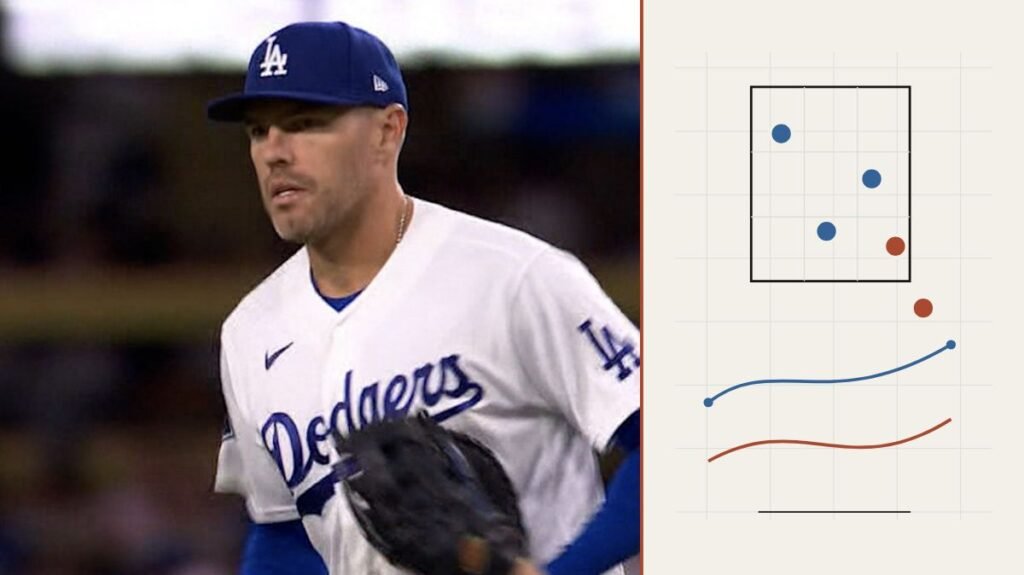
Justin Wrobleski reached two strikes against Christian Yelich immediately after entering the eighth. A slider foul and a missed 97.1 mph fastball put him ahead, but the next slider escaped for a wild pitch that scored Brice Turang from third. Wrobleski recovered to strike Yelich out on an 85.9 mph sweeper.
The run belonged to Roki Sasaki, who had left runners at first and third with one out. Wrobleski then struck out Jake Bauers to strand the remaining runner. His final line included five outs, two hits, one earned run, no walks and three strikeouts on 32 pitches in Los Angeles’ 6–2 Game 3 loss.
The comparison uses 192 physical pitches in six regular-season Dodgers relief appearances from March 30 through September 27. It excludes his starting work, which would otherwise dominate a full-season pitch sample and blur the role comparison.
Season repertoire and Game 3
Scale: 0–100%. Gray: regular season. Blue: Game 3.
Four-seam fastball
Change: +7.3 percentage points.
Slider
Change: -12.0 percentage points.
Sweeper
Change: +13.5 percentage points.
Changeup
Change: +2.6 percentage points.
Sinker
Change: -7.3 percentage points.
Cutter
Change: -3.1 percentage points.
Curveball
Change: -1.0 percentage points.
Five classifications and three strikeout finishes
Wrobleski threw 17 four-seamers, seven sliders, six sweepers, one changeup and one sinker. The four-seam share rose from 45.8% in the relief baseline to 53.1%, while the sweeper rose from 5.2% to 18.8%. Slider share fell from 33.9% to 21.9%. The six-appearance baseline makes these descriptive differences rather than an established new pattern.
Four-seamers averaged 96.9 mph against 95.6 in the comparison sample. They supplied five called strikes and two misses in seven attempts. Sliders and sweepers each supplied another miss, and the lone changeup was taken for a strike. Overall, hitters missed four of 14 attempts, while Wrobleski added eight called strikes.
He finished each of his three strikeouts with a different classification: Yelich on the sweeper, Bauers on a called slider and Garrett Mitchell on a called four-seamer to open the ninth. That variety matters more than crediting all three outs to the pitch that appeared most often.
Pitch measurements and hitter response
| Pitch | Count | Mean mph | Max mph | Mean spin rpm | Induced vertical break in. | Horizontal movement magnitude in. | Misses / attempts | Called strikes |
|---|---|---|---|---|---|---|---|---|
| Four-seam fastball | 17 | 96.9 | 98.1 | 2568 | 16.3 | 6.1 | 2 / 7 | 5 |
| Slider | 7 | 88.8 | 90.4 | 2666 | -1.3 | 4.4 | 1 / 5 | 1 |
| Sweeper | 6 | 85.8 | 87.0 | 2709 | -2.6 | 16.5 | 1 / 2 | 1 |
| Changeup | 1 | 83.6 | 83.6 | 1627 | 3.2 | 14.3 | 0 / 0 | 1 |
| Sinker | 1 | 95.9 | 95.9 | 2349 | 9.1 | 17.5 | 0 / 0 | 0 |
All outing pitches have speed, spin, movement, extension and plate-location measurements. Movement uses Savant’s explicit induced-vertical and horizontal fields. Misses include caught foul tips and missed bunts under the event definitions below. Pitch-type movement averages use all pitches of that classification.
Christian Yelich: inning 8
One inherited run and one charged run
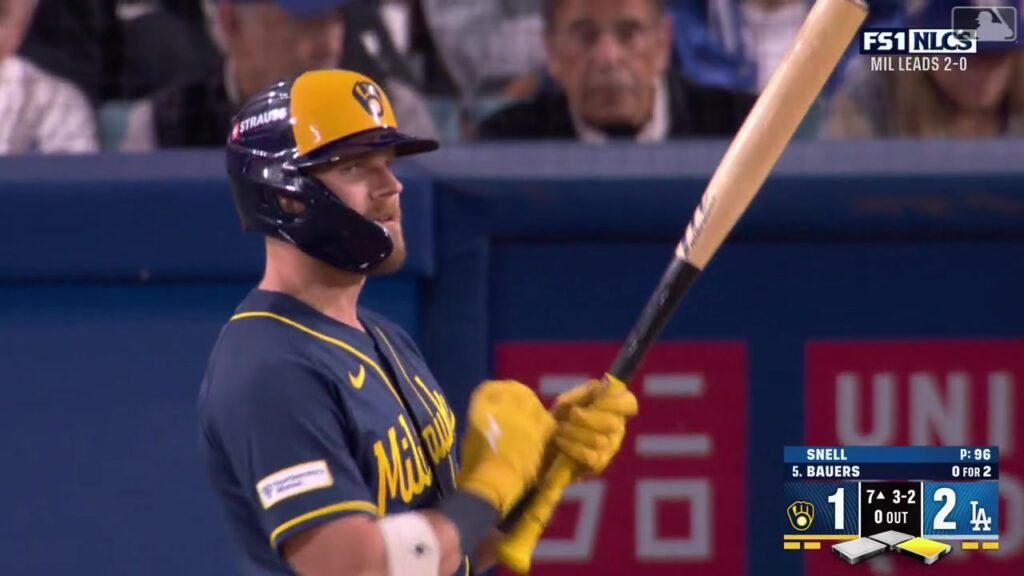
The opening wild pitch scored an inherited runner and moved Contreras to second. Contreras did not score. Wrobleski’s own charged run came in the ninth, when Cooper Pratt singled, stole second after a review upheld the safe call, and scored on Joey Ortiz’s 95.0 mph single.
Four balls were put into play against Wrobleski. Their average exit velocity was 81.9 mph, with Ortiz’s single the only one to reach the hard-hit threshold. The hardest contact arrived after a seven-pitch plate appearance in which Ortiz fouled off two two-strike offerings before grounding a slider through for the hit.
Wrobleski used 10 pitches for the final two outs of the eighth and 22 in the ninth. His four-seamer averaged 97.4 mph on four measured pitches in the eighth and 96.7 on 13 in the ninth. Those are the actual samples behind the difference; the record supplies no diagnosis of fatigue.
The appearance showed several ways to finish hitters, but it also contained two distinct scoring events. Keeping the inherited runner separate from Pratt’s run preserves both the official one-run line and the fuller account of how Milwaukee added its last two runs.
Inning samples in context
| Inning | Pitches | Cumulative | Four-seam fastball mph | Measured n | Outs |
|---|---|---|---|---|---|
| 8* | 10 | 10 | 97.4 | 4 | 2 |
| 9 | 22 | 32 | 96.7 | 13 | 3 |
Every pitch: 32 of 32
Search a hitter, select an inning or pitch type, then inspect a pitch number. Pitch result and completed plate-appearance outcome are separate columns. The table scrolls within its border.
32 of 32 pitches
No pitches match these filters.
| Pitch | Inning | Hitter | Count before | Type | mph | Pitch result | Completed PA |
|---|---|---|---|---|---|---|---|
| 8 | Christian Yelich | 0–0 | SL | 88.6 | Foul | Strikeout | |
| 8 | Christian Yelich | 0–1 | FF | 97.1 | Swinging Strike | Strikeout | |
| 8 | Christian Yelich | 0–2 | SL | 88.0 | Ball | Strikeout | |
| 8 | Christian Yelich | 1–2 | FF | 97.6 | Ball | Strikeout | |
| 8 | Christian Yelich | 2–2 | ST | 85.9 | Swinging Strike | Strikeout | |
| 8 | Jake Bauers | 0–0 | ST | 84.9 | Ball | Strikeout | |
| 8 | Jake Bauers | 1–0 | FF | 97.1 | Swinging Strike | Strikeout | |
| 8 | Jake Bauers | 1–1 | FF | 97.8 | Ball | Strikeout | |
| 8 | Jake Bauers | 2–1 | SL | 89.7 | Swinging Strike | Strikeout | |
| 8 | Jake Bauers | 2–2 | SL | 88.4 | Called Strike | Strikeout | |
| 9 | Garrett Mitchell | 0–0 | SI | 95.9 | Ball | Strikeout | |
| 9 | Garrett Mitchell | 1–0 | FF | 96.0 | Called Strike | Strikeout | |
| 9 | Garrett Mitchell | 1–1 | ST | 87.0 | Ball | Strikeout | |
| 9 | Garrett Mitchell | 2–1 | FF | 96.6 | Called Strike | Strikeout | |
| 9 | Garrett Mitchell | 2–2 | FF | 97.8 | Called Strike | Strikeout | |
| 9 | Cooper Pratt | 0–0 | ST | 85.8 | Called Strike | Single | |
| 9 | Cooper Pratt | 0–1 | FF | 98.1 | Ball | Single | |
| 9 | Cooper Pratt | 1–1 | FF | 97.4 | Ball | Single | |
| 9 | Cooper Pratt | 2–1 | ST | 86.0 | In play, no out | Single | |
| 9 | Luis Lara | 0–0 | FF | 96.2 | Called Strike | Lineout | |
| 9 | Luis Lara | 0–1 | FF | 96.0 | Foul | Lineout | |
| 9 | Luis Lara | 0–2 | FF | 96.7 | In play, out(s) | Lineout | |
| 9 | Joey Ortiz | 0–0 | ST | 85.4 | Ball | Single | |
| 9 | Joey Ortiz | 1–0 | FF | 96.4 | Foul | Single | |
| 9 | Joey Ortiz | 1–1 | FF | 96.9 | Ball | Single | |
| 9 | Joey Ortiz | 2–1 | FF | 95.2 | Foul | Single | |
| 9 | Joey Ortiz | 2–2 | FF | 97.4 | Foul | Single | |
| 9 | Joey Ortiz | 2–2 | SL | 90.4 | Foul | Single | |
| 9 | Joey Ortiz | 2–2 | SL | 88.9 | In play, run(s) | Single | |
| 9 | Jackson Chourio | 0–0 | CH | 83.6 | Called Strike | Groundout | |
| 9 | Jackson Chourio | 0–1 | FF | 96.8 | Called Strike | Groundout | |
| 9 | Jackson Chourio | 0–2 | SL | 87.6 | In play, out(s) | Groundout |
Sources, definitions and limitations
The official final MLB record supplies events, final calls and the line. Baseball Savant’s complete Game 3 feed supplies all 32 physical pitches. Pitch ID, order, classification and pre-pitch count reconcile, including final ABS decisions. These records contain 7 batters, 5 integer outs and 3 strikeouts. In baseball notation, .1 means one out and .2 two outs. Source records current as of October 14, 2026.
The Statcast Search baseline is 192 physical pitches in 6 regular-season relief appearances for Los Angeles Dodgers, 2026-03-30 through 2026-09-27. Each game total reconciles with the official appearance log. Target game, postseason work, other clubs and other roles are excluded.
Whiff rate means misses divided by physical swing attempts. Swinging strikes, blocked swinging strikes, caught foul tips and missed bunts count as misses. Fouls, bunt attempts and balls put into play enter the attempt denominator. Both outing and baseline use the same definitions. Called strikes and completed strikeout plate appearances are separate. Chase uses ball-center coordinates outside a 17-inch-wide rectangle and each pitch’s recorded vertical boundaries. Only complete coordinates enter the zone denominator. Savant’s separate zone flag remains in the CSV and detail rather than replacing that geometric definition.
Speed is mph, spin rpm, extension feet and movement inches. Induced vertical break describes movement relative to a gravity-only path. Location and zone boundaries are feet in catcher view. Numbered markers preserve exact coordinates and are not ball size. Release, location, spin, extension and movement measurements are complete for all outing pitches. Contact and expected-outcome measurements can be unavailable and remain missing in the detail and CSV. 4 of 4 balls put into play have measured exit speed. Hard-hit means at least 95 mph; the baseline has 39 measured contacts among 39. Expected outcomes are Savant model estimates, not actual results. The comparisons are descriptive and do not establish intention, fatigue, injury or a durable trend.
Reading the rates
Called strikes plus misses: 12 / 32 physical pitches (37.5%). Swinging-strike rate: 4 / 32 (12.5%). Whiff rate: 4 / 14 swing attempts (28.6%). Chase: 7 / 20 pitches outside the ball-center rectangle (35.0%). All 32 pitches have usable zone coordinates. Rates use final corrected calls and retain caught foul tips in the miss category.
The MLB and Savant raw fields are preserved separately in the downloadable record. Savant plate coordinates define the plotted locations and the zone calculation. MLB coordinates can use a different reference plane. Unavailable expected-outcome values and launch angles remain blank. The CSV distinguishes the pitch result from the completed plate-appearance outcome.
Sources and notes
- Official final MLB Game 849811: https://statsapi.mlb.com/api/v1.1/game/849811/feed/live
- Baseball Savant complete game: https://baseballsavant.mlb.com/gf?game_pk=849811
- Regular season, matching club and role: 192 physical pitches, 2026-03-30 through 2026-09-27. Per-appearance totals reconciled.
- Pitch definitions: https://baseballsavant.mlb.com/csv-docs