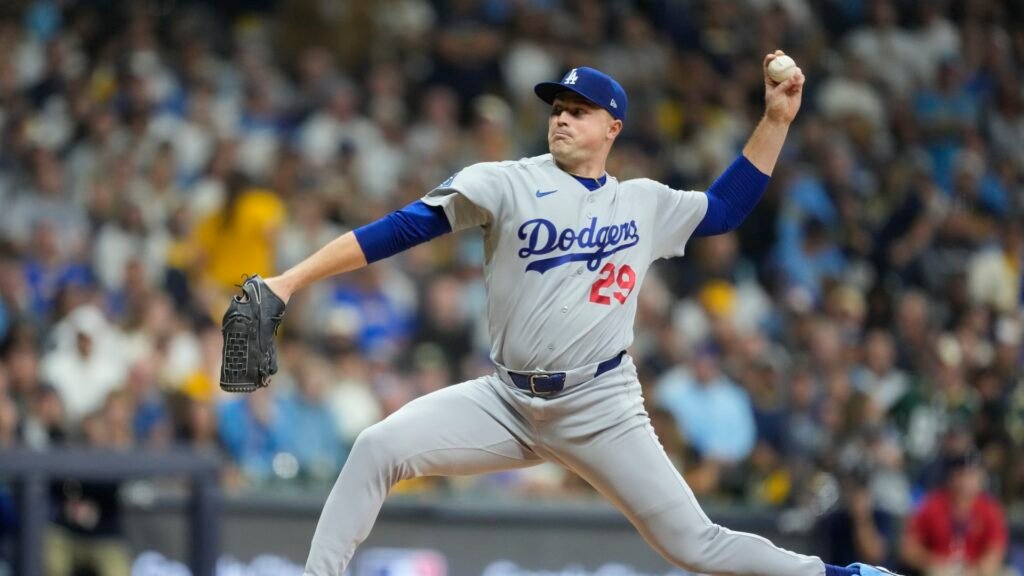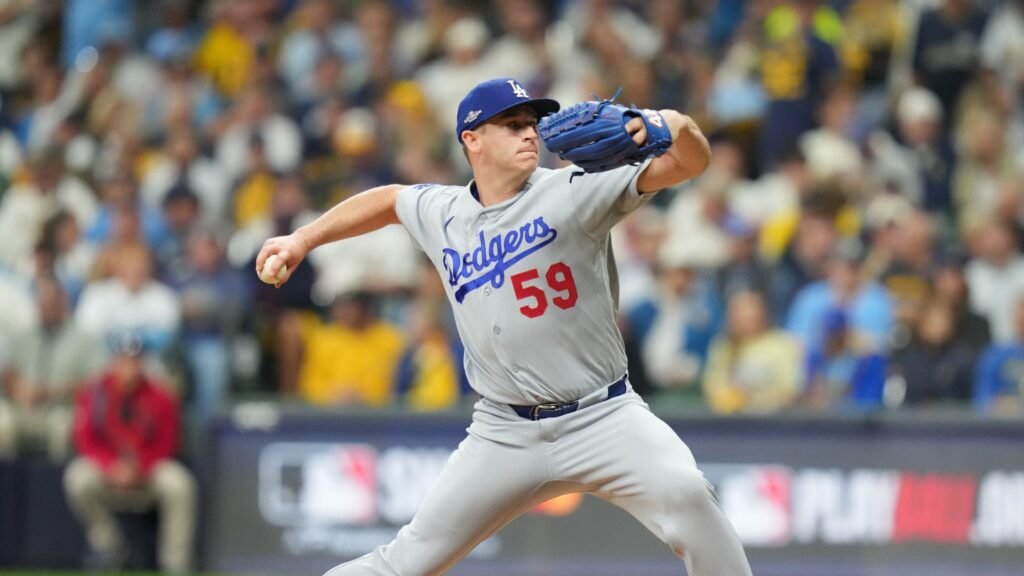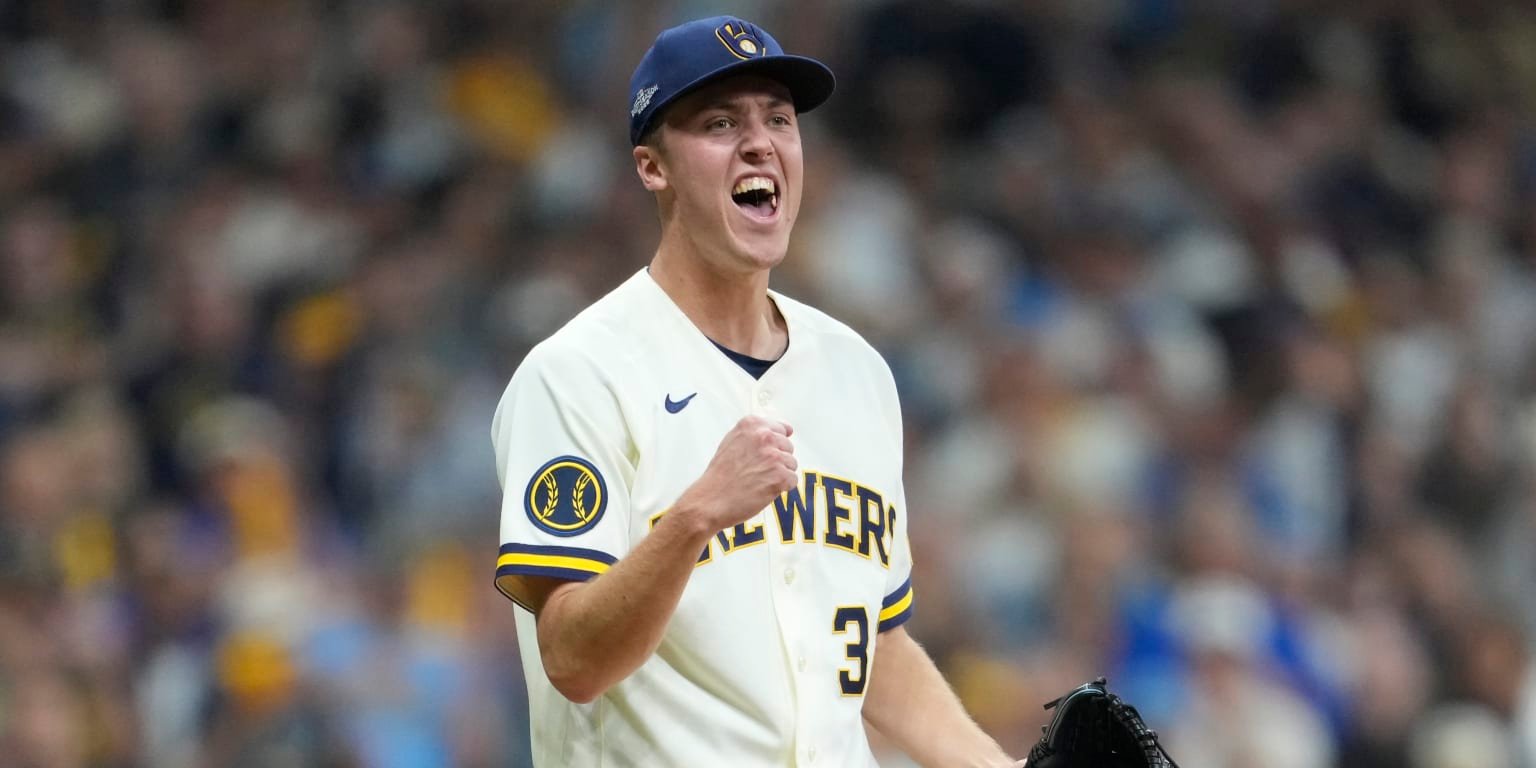
Kyle Tucker had already drawn a 10-pitch walk in the second inning when he faced Jacob Misiorowski again with two outs in the fourth. This time Misiorowski used all four of his recorded pitch types. A 94.5 mph cutter supplied a called strike, two slower breaking balls missed the zone, and a 94.3 mph cutter ended the full-count confrontation with a swinging strike.
That six-pitch strikeout stranded Teoscar Hernández at second, but it also brought Misiorowski’s total to 85 pitches through four innings. He finished with five strikeouts, five hits and three walks over 4⅓ innings in Milwaukee’s 2–1 victory over the Dodgers in NLCS Game 1 at American Family Field on October 11.
The fastball’s speed was still there. The difference was what Los Angeles did against it and how much work the surrounding plate appearances required. Misiorowski recorded 10 misses on 42 swing attempts, while the Dodgers fouled off 21 pitches. The outing combined useful strike acquisition with enough contact and deep counts to make an early bullpen handoff necessary.
Season repertoire and Game 1
Scale: 0–100%. Gray: regular season. Blue: Game 1.
Four-seam fastball
Change: +2.6 percentage points.
Slider
Change: +11.1 percentage points.
Cutter
Change: -7.6 percentage points.
Curveball
Change: -5.0 percentage points.
Changeup
Change: -1.1 percentage points.
Sinker
Change: -0.1 percentage points.
Fastball speed held, but the misses changed
The comparison is 2,647 physical pitches in Misiorowski’s 30 regular-season starts for Milwaukee, from March 26 through September 27. His four-seamer averaged 100.7 mph in Game 1 against 100.6 mph in that sample. It accounted for 62 of his 94 pitches, or 66.0%, compared with 63.4% during those starts. Neither measure supports an explanation built around a large loss of overall fastball speed.
Los Angeles attempted to hit 27 four-seamers and missed five, an 18.5% whiff rate. The comparable season record was 345 misses on 859 attempts, or 40.2%. Six fastballs became balls put into play and another 16 were fouled off. Those outcomes kept hitters involved even when the pitch remained exceptionally fast.
Misiorowski increased his slider share from 11.2% to 22.3%, throwing 21 at an average of 90.3 mph. The season average for that classification was 91.8 mph. Cutter use fell from 13.9% to 6.4%, and curveballs fell from 10.3% to 5.3%. The recorded categories matter: the complete MLB event record and Savant feed agree on them, even where a video-page pitch label differs.
A miss and a strikeout describe different parts of the record. Misiorowski finished two strikeouts with four-seamers and one each with a slider, curveball and cutter. He also collected 18 called strikes, 14 on four-seamers. His five strikeouts therefore cannot be evaluated only through the 10 missed swings, and the cutter that finished Tucker was useful despite appearing only six times.
The opposing sides of the plate supplied different responses. Left-handed hitters missed nine of 21 attempts, or 42.9%, close to their 42.7% regular-season comparison. Right-handed hitters missed once in 21 attempts, compared with 29.6% during the season. Each game split is small, but combining them into one rate would hide the sharp difference within this outing.
Slider use also rose against both groups. It made up 11 of 43 pitches to left-handed hitters, compared with 98 of 1,497 in the baseline, and 10 of 51 to right-handed hitters, compared with 199 of 1,150. The overall increase was not simply the product of facing a different proportion of left-handed hitters. That still does not establish a planned adjustment without an attributable explanation from Misiorowski.
Kyle Tucker: inning 4
Double plays limited damage that the contact record still reveals
Los Angeles put 11 balls into play against him, with measured exit speeds averaging 95.5 mph. Six reached the 95 mph hard-hit threshold, compared with 33.5% of measured contact in his season starts. Will Smith’s first-inning grounder left the bat at 102.0 mph and nevertheless became a double play. Hard contact and a favorable defensive result can appear on the same pitch.
The second inning consumed 35 pitches. Shohei Ohtani walked on four, Hernández singled after a seven-pitch plate appearance, and Andy Pages drove in Ohtani. Tucker’s 10-pitch walk loaded the bases with one out. Misiorowski then needed seven pitches against Enrique Hernández, whose 87.6 mph grounder started another inning-ending double play. That escape limited the score without recovering the pitches already spent.
His four-seam inning averages moved from 101.9 mph in the first to 99.3 in the fourth and 99.2 in his partial fifth. Those samples contain 11, eight and six fastballs respectively. They document a decline within this start, while the full-outing average stayed near his season level. They cannot diagnose fatigue, injury or the intended location of a pitch.
Misiorowski retired Enrique Hernández to begin the fifth, then walked Mookie Betts on seven pitches. DL Hall inherited Betts at first and induced a Freddie Freeman double play with four pitches, preserving Misiorowski’s one-run line. Milwaukee scored its go-ahead run in the bottom half and its four relievers completed 4⅔ scoreless innings.
The complete record explains an early exit without treating the win as proof of overwhelming execution. Misiorowski retained high velocity, acquired strikes in several ways and received important double plays. The Dodgers made more contact than his season comparison and repeatedly extended the work. The next useful comparison is whether that fastball begins missing bats at its usual rate again while he reaches later innings with fewer pitches.
Inning samples in context
| Inning | Pitches | Cumulative | Four-seam fastball mph | Measured n | Outs |
|---|---|---|---|---|---|
| 1 | 12 | 12 | 101.9 | 11 | 3 |
| 2 | 35 | 47 | 101.4 | 25 | 3 |
| 3 | 22 | 69 | 99.8 | 12 | 3 |
| 4 | 16 | 85 | 99.3 | 8 | 3 |
| 5* | 9 | 94 | 99.2 | 6 | 1 |
Every pitch: 94 of 94
Search a hitter, select an inning or pitch type, then inspect a pitch number. Pitch result and completed plate-appearance outcome are separate columns. The table scrolls within its border.
94 of 94 pitches
No pitches match these filters.
| Pitch | Inning | Hitter | Count before | Type | mph | Pitch result | Completed PA |
|---|---|---|---|---|---|---|---|
| 1 | Mookie Betts | 0–0 | FF | 102.3 | Called Strike | Groundout | |
| 1 | Mookie Betts | 0–1 | FF | 102.9 | Ball | Groundout | |
| 1 | Mookie Betts | 1–1 | FF | 100.7 | Ball | Groundout | |
| 1 | Mookie Betts | 2–1 | FF | 100.7 | In play, out(s) | Groundout | |
| 1 | Freddie Freeman | 0–0 | FF | 104.0 | Swinging Strike | Single | |
| 1 | Freddie Freeman | 0–1 | FF | 103.1 | Foul | Single | |
| 1 | Freddie Freeman | 0–2 | FF | 101.0 | Foul | Single | |
| 1 | Freddie Freeman | 0–2 | FF | 102.1 | Foul | Single | |
| 1 | Freddie Freeman | 0–2 | FF | 101.6 | In play, no out | Single | |
| 1 | Will Smith | 0–0 | FF | 101.8 | Called Strike | GIDP | |
| 1 | Will Smith | 0–1 | FF | 100.9 | Called Strike | GIDP | |
| 1 | Will Smith | 0–2 | SL | 91.2 | In play, out(s) | GIDP | |
| 2 | Shohei Ohtani | 0–0 | FF | 102.6 | Ball | Walk | |
| 2 | Shohei Ohtani | 1–0 | FF | 101.7 | Ball | Walk | |
| 2 | Shohei Ohtani | 2–0 | FF | 101.7 | Ball | Walk | |
| 2 | Shohei Ohtani | 3–0 | FF | 102.4 | Ball | Walk | |
| 2 | Teoscar Hernández | 0–0 | FF | 101.8 | Ball | Single | |
| 2 | Teoscar Hernández | 1–0 | CU | 88.2 | Ball | Single | |
| 2 | Teoscar Hernández | 2–0 | FF | 100.6 | Called Strike | Single | |
| 2 | Teoscar Hernández | 2–1 | FF | 102.1 | Ball | Single | |
| 2 | Teoscar Hernández | 3–1 | FF | 100.0 | Called Strike | Single | |
| 2 | Teoscar Hernández | 3–2 | FF | 101.4 | Foul | Single | |
| 2 | Teoscar Hernández | 3–2 | FF | 102.6 | In play, no out | Single | |
| 2 | Max Muncy | 0–0 | FF | 102.1 | Swinging Strike | Strikeout | |
| 2 | Max Muncy | 0–1 | FF | 101.5 | Called Strike | Strikeout | |
| 2 | Max Muncy | 0–2 | FF | 102.2 | Ball | Strikeout | |
| 2 | Max Muncy | 1–2 | FF | 101.5 | Swinging Strike | Strikeout | |
| 2 | Andy Pages | 0–0 | FF | 101.0 | Called Strike | Single | |
| 2 | Andy Pages | 0–1 | SL | 88.4 | Ball | Single | |
| 2 | Andy Pages | 1–1 | FF | 100.4 | In play, run(s) | Single | |
| 2 | Kyle Tucker | 0–0 | SL | 92.5 | Called Strike | Walk | |
| 2 | Kyle Tucker | 0–1 | FF | 101.0 | Ball | Walk | |
| 2 | Kyle Tucker | 1–1 | SL | 91.7 | Swinging Strike | Walk | |
| 2 | Kyle Tucker | 1–2 | FF | 100.6 | Foul | Walk | |
| 2 | Kyle Tucker | 1–2 | SL | 91.8 | Foul | Walk | |
| 2 | Kyle Tucker | 1–2 | FF | 101.7 | Foul | Walk | |
| 2 | Kyle Tucker | 1–2 | CU | 89.0 | Ball In Dirt | Walk | |
| 2 | Kyle Tucker | 2–2 | SL | 92.0 | Ball | Walk | |
| 2 | Kyle Tucker | 3–2 | FF | 100.1 | Foul | Walk | |
| 2 | Kyle Tucker | 3–2 | FC | 93.3 | Ball | Walk | |
| 2 | Enrique Hernández | 0–0 | FF | 101.7 | Called Strike | GIDP | |
| 2 | Enrique Hernández | 0–1 | FF | 101.6 | Called Strike | GIDP | |
| 2 | Enrique Hernández | 0–2 | FF | 100.8 | Ball | GIDP | |
| 2 | Enrique Hernández | 1–2 | FF | 100.7 | Foul | GIDP | |
| 2 | Enrique Hernández | 1–2 | FF | 100.4 | Ball | GIDP | |
| 2 | Enrique Hernández | 2–2 | SL | 89.8 | Foul | GIDP | |
| 2 | Enrique Hernández | 2–2 | SL | 89.5 | In play, out(s) | GIDP | |
| 3 | Mookie Betts | 0–0 | FC | 93.3 | Ball | Single | |
| 3 | Mookie Betts | 1–0 | FF | 98.7 | Ball | Single | |
| 3 | Mookie Betts | 2–0 | FF | 99.7 | Ball | Single | |
| 3 | Mookie Betts | 3–0 | FF | 99.1 | Called Strike | Single | |
| 3 | Mookie Betts | 3–1 | FF | 99.1 | Foul | Single | |
| 3 | Mookie Betts | 3–2 | FF | 99.4 | Foul | Single | |
| 3 | Mookie Betts | 3–2 | FF | 99.1 | In play, no out | Single | |
| 3 | Freddie Freeman | 0–0 | SL | 91.8 | Foul | Strikeout | |
| 3 | Freddie Freeman | 0–1 | SL | 91.5 | Called Strike | Strikeout | |
| 3 | Freddie Freeman | 0–2 | FF | 100.2 | Foul | Strikeout | |
| 3 | Freddie Freeman | 0–2 | CU | 88.6 | Ball In Dirt | Strikeout | |
| 3 | Freddie Freeman | 1–2 | SL | 89.1 | Swinging Strike | Strikeout | |
| 3 | Will Smith | 0–0 | SL | 92.3 | Swinging Strike | Flyout | |
| 3 | Will Smith | 0–1 | FF | 99.5 | Ball | Flyout | |
| 3 | Will Smith | 1–1 | SL | 88.0 | Foul | Flyout | |
| 3 | Will Smith | 1–2 | FF | 99.3 | Foul | Flyout | |
| 3 | Will Smith | 1–2 | SL | 88.8 | In play, out(s) | Flyout | |
| 3 | Shohei Ohtani | 0–0 | FF | 100.6 | Called Strike | Strikeout | |
| 3 | Shohei Ohtani | 0–1 | FF | 101.8 | Ball | Strikeout | |
| 3 | Shohei Ohtani | 1–1 | SL | 89.9 | Ball | Strikeout | |
| 3 | Shohei Ohtani | 2–1 | SL | 90.6 | Swinging Strike | Strikeout | |
| 3 | Shohei Ohtani | 2–2 | FF | 100.8 | Swinging Strike | Strikeout | |
| 4 | Teoscar Hernández | 0–0 | FF | 99.5 | Called Strike | Single | |
| 4 | Teoscar Hernández | 0–1 | SL | 90.1 | In play, no out | Single | |
| 4 | Max Muncy | 0–0 | FF | 98.8 | Foul | Strikeout | |
| 4 | Max Muncy | 0–1 | SL | 88.4 | Ball | Strikeout | |
| 4 | Max Muncy | 1–1 | FF | 99.2 | Swinging Strike | Strikeout | |
| 4 | Max Muncy | 1–2 | CU | 86.4 | Called Strike | Strikeout | |
| 4 | Andy Pages | 0–0 | FF | 98.8 | Called Strike | Flyout | |
| 4 | Andy Pages | 0–1 | FF | 100.0 | Ball | Flyout | |
| 4 | Andy Pages | 1–1 | FF | 98.5 | Ball | Flyout | |
| 4 | Andy Pages | 2–1 | FC | 93.6 | In play, out(s) | Flyout | |
| 4 | Kyle Tucker | 0–0 | FF | 100.3 | Foul | Strikeout | |
| 4 | Kyle Tucker | 0–1 | FF | 99.4 | Ball | Strikeout | |
| 4 | Kyle Tucker | 1–1 | FC | 94.5 | Called Strike | Strikeout | |
| 4 | Kyle Tucker | 1–2 | SL | 89.5 | Ball | Strikeout | |
| 4 | Kyle Tucker | 2–2 | CU | 86.6 | Ball | Strikeout | |
| 4 | Kyle Tucker | 3–2 | FC | 94.3 | Swinging Strike | Strikeout | |
| 5 | Enrique Hernández | 0–0 | FF | 98.9 | Called Strike | Flyout | |
| 5 | Enrique Hernández | 0–1 | FF | 99.2 | In play, out(s) | Flyout | |
| 5 | Mookie Betts | 0–0 | FF | 100.0 | Ball | Walk | |
| 5 | Mookie Betts | 1–0 | FC | 94.0 | Ball | Walk | |
| 5 | Mookie Betts | 2–0 | FF | 100.0 | Foul | Walk | |
| 5 | Mookie Betts | 2–1 | FF | 98.5 | Ball | Walk | |
| 5 | Mookie Betts | 3–1 | FF | 98.8 | Foul | Walk | |
| 5 | Mookie Betts | 3–2 | SL | 91.2 | Foul | Walk | |
| 5 | Mookie Betts | 3–2 | SL | 88.6 | Ball | Walk |
Sources, definitions and limitations
The official final MLB record supplies events, final calls and the line. Baseball Savant’s complete Game 1 feed supplies all 94 physical pitches. Pitch ID, order, classification and pre-pitch count reconcile, including final ABS decisions. These records contain 19 batters, 13 integer outs and 5 strikeouts. In baseball notation, .1 means one out and .2 two outs. Source records current as of October 12, 2026.
The Statcast Search baseline is 2,647 physical pitches in 30 regular-season starter appearances for Milwaukee Brewers, 2026-03-26 through 2026-09-27. Each game total reconciles with the official appearance log. Target game, postseason work, other clubs and other roles are excluded.
Whiff rate means misses divided by physical swing attempts. Swinging strikes, blocked swinging strikes, caught foul tips and missed bunts count as misses. Fouls, bunt attempts and balls put into play enter the attempt denominator. Both outing and baseline use the same definitions. Called strikes and completed strikeout plate appearances are separate. Chase uses ball-center coordinates outside a 17-inch-wide rectangle and each pitch’s recorded vertical boundaries. Only complete coordinates enter the zone denominator. Savant’s separate zone flag remains in the CSV and detail rather than replacing that geometric definition.
Speed is mph, spin rpm, extension feet and movement inches. Induced vertical break describes movement relative to a gravity-only path. Location and zone boundaries are feet in catcher view. Numbered markers preserve exact coordinates and are not ball size. Release, location, spin, extension and movement measurements are complete for all outing pitches. Contact and expected-outcome measurements can be unavailable and remain missing in the detail and CSV. 11 of 11 balls put into play have measured exit speed. Hard-hit means at least 95 mph; the baseline has 358 measured contacts among 360. Expected outcomes are Savant model estimates, not actual results. The comparisons are descriptive and do not establish intention, fatigue, injury or a durable trend.