Andy Pages missed a 98.3 mph sinker with runners at first and third and two outs in the sixth. He took Uribe’s next sinker at 100.0 mph for a called strike, then missed a 98.6 mph sinker to end the inning. Three pitches supplied the final escape, without a breaking ball in the confrontation.
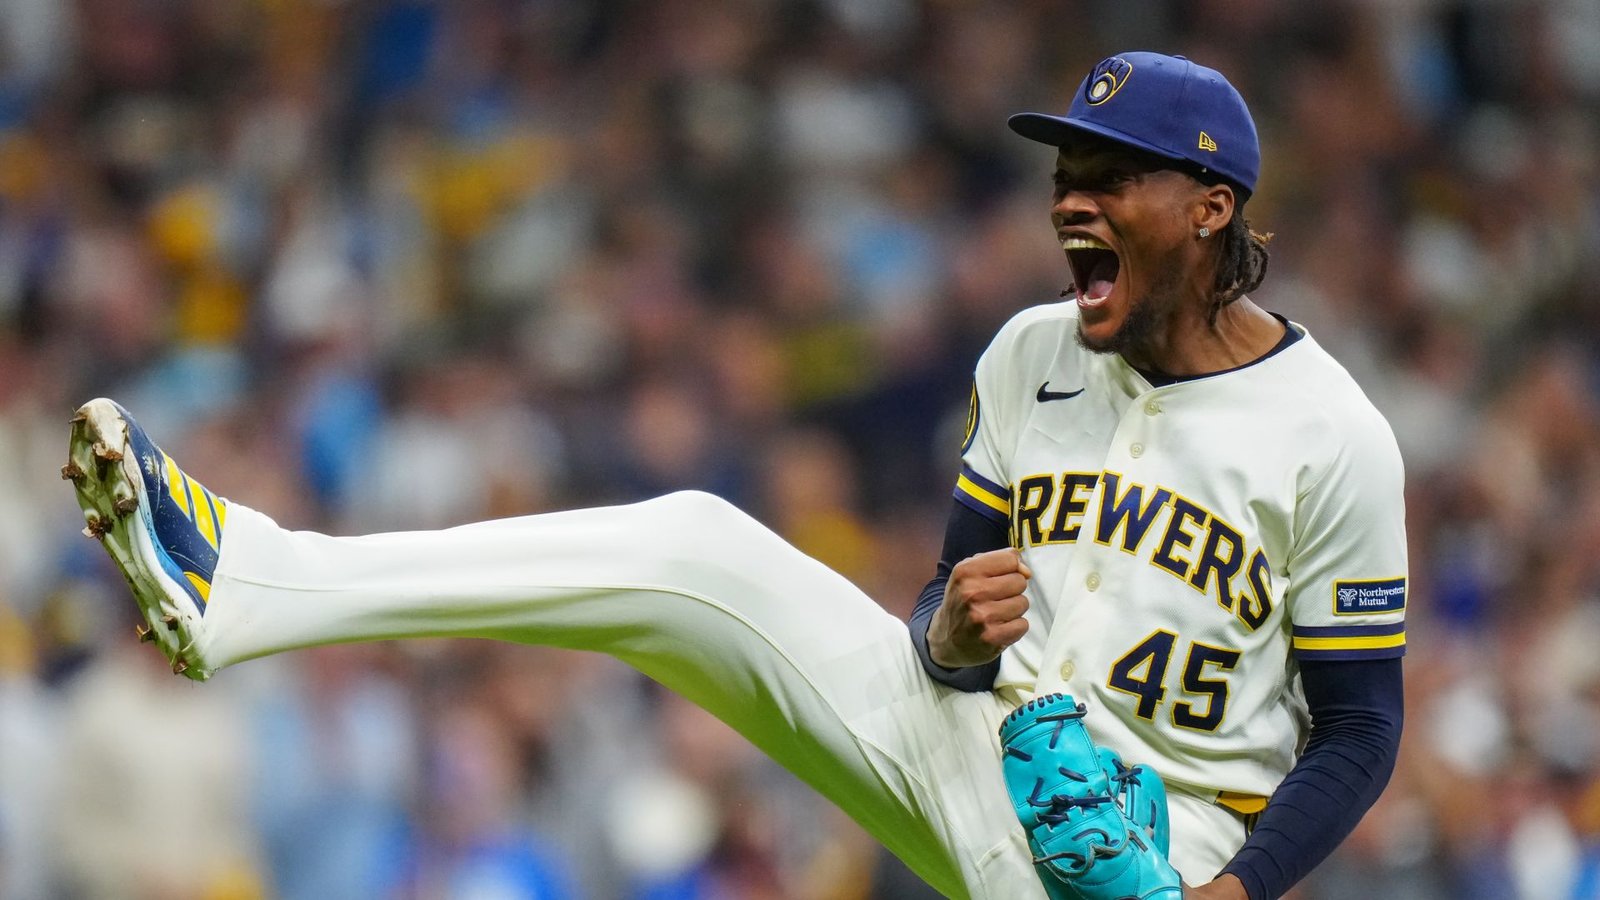
Abner Uribe preserved Milwaukee’s 2–1 lead in NLCS Game 1 against the Dodgers at American Family Field on October 11. He struck out two, allowed two singles and walked nobody in a 15-pitch inning. The run prevention and the baserunners belong in the same account.
His pitch mix was close to his regular-season relief pattern, and his sinker speed was nearly unchanged. The finish illustrates how takes and missed swings worked together, rather than establishing that Uribe introduced a new approach because the inning ended scoreless.
Season repertoire and Game 1
Scale: 0–100%. Gray: regular season. Blue: Game 1.
Sinker
Change: +4.9 percentage points.
Slider
Change: -4.7 percentage points.
Four-seam fastball
Change: -0.2 percentage points.
The usual pairing, with faster sliders
Uribe threw 10 sinkers and five sliders. The sinker share was 66.7%, compared with 61.8% across 918 pitches in 61 regular-season Milwaukee relief appearances from March 28 through September 25. Slider share was 33.3% against 38.0%. Those counts describe a modest selection difference in a short outing.
His sinkers averaged 98.9 mph, compared with 98.8 in the baseline. Sliders averaged 89.1 mph across five pitches, compared with 87.9 during the season. Both classifications produced a missed swing: three on sinkers and one on a slider. The slider finished Teoscar Hernández’s strikeout, while sinkers finished Pages.
The Dodgers missed four of eight attempts, a 50.0% whiff rate against 26.8% in the season comparison. Uribe also collected five called strikes, three on sinkers and two on sliders. The taken strike in the middle of Pages’ sequence was as necessary to the quick finish as the two swings around it.
Andy Pages: inning 6
The two singles created real scoring pressure
Will Smith opened with a 95.6 mph flyout. Shohei Ohtani then singled on a slider with a 74.0 mph exit speed. After Hernández struck out, Max Muncy hit a 98.3 mph sinker at 106.7 mph for a single that moved Ohtani to third. The singles had very different contact speeds, but each created an actual baserunner.
Two of the three balls put into play reached the hard-hit threshold, including Smith’s out. Their average exit speed was 92.1 mph. Three contacts cannot establish a trend, and a scoreless inning does not make the 106.7 mph grounder disappear from the evaluation.
Twelve of Uribe’s 15 pitches finished inside the defined ball-center zone rectangle. That geometric result differs from the official strike count, which also reflects swings, fouls and final calls. Only three pitches were outside the rectangle and one drew an attempt, leaving too little outside-zone opportunity for a strong chase-rate conclusion.
Uribe’s contribution was the ability to finish the threat with three sinkers after the two singles. His established pairing supplied strikes quickly, and he needed only 15 pitches to face five batters. Whether that swing response repeats is a separate question from the verified escape that kept Milwaukee ahead.
Inning samples in context
| Inning | Pitches | Cumulative | Sinker mph | Measured n | Outs |
|---|---|---|---|---|---|
| 6 | 15 | 15 | 98.9 | 10 | 3 |
Every pitch: 15 of 15
Search a hitter, select an inning or pitch type, then inspect a pitch number. Pitch result and completed plate-appearance outcome are separate columns. The table scrolls within its border.
15 of 15 pitches
No pitches match these filters.
| Pitch | Inning | Hitter | Count before | Type | mph | Pitch result | Completed PA |
|---|---|---|---|---|---|---|---|
| 6 | Will Smith | 0–0 | SI | 97.9 | Called Strike | Flyout | |
| 6 | Will Smith | 0–1 | SI | 100.3 | In play, out(s) | Flyout | |
| 6 | Shohei Ohtani | 0–0 | SI | 98.9 | Swinging Strike | Single | |
| 6 | Shohei Ohtani | 0–1 | SI | 98.9 | Called Strike | Single | |
| 6 | Shohei Ohtani | 0–2 | SI | 98.8 | Foul | Single | |
| 6 | Shohei Ohtani | 0–2 | SL | 89.7 | In play, no out | Single | |
| 6 | Teoscar Hernández | 0–0 | SL | 88.8 | Called Strike | Strikeout | |
| 6 | Teoscar Hernández | 0–1 | SL | 89.0 | Called Strike | Strikeout | |
| 6 | Teoscar Hernández | 0–2 | SL | 88.2 | Swinging Strike | Strikeout | |
| 6 | Max Muncy | 0–0 | SI | 98.6 | Ball | Single | |
| 6 | Max Muncy | 1–0 | SL | 90.0 | Ball | Single | |
| 6 | Max Muncy | 2–0 | SI | 98.3 | In play, no out | Single | |
| 6 | Andy Pages | 0–0 | SI | 98.3 | Swinging Strike | Strikeout | |
| 6 | Andy Pages | 0–1 | SI | 100.0 | Called Strike | Strikeout | |
| 6 | Andy Pages | 0–2 | SI | 98.6 | Swinging Strike | Strikeout |
Sources, definitions and limitations
The official final MLB record supplies events, final calls and the line. Baseball Savant’s complete Game 1 feed supplies all 15 physical pitches. Pitch ID, order, classification and pre-pitch count reconcile, including final ABS decisions. These records contain 5 batters, 3 integer outs and 2 strikeouts. In baseball notation, .1 means one out and .2 two outs. Source records current as of October 12, 2026.
The Statcast Search baseline is 918 physical pitches in 61 regular-season relief appearances for Milwaukee Brewers, 2026-03-28 through 2026-09-25. Each game total reconciles with the official appearance log. Target game, postseason work, other clubs and other roles are excluded. 1 baseline pitches lack spin rate; excluded from that measure.
Whiff rate means misses divided by physical swing attempts. Swinging strikes, blocked swinging strikes, caught foul tips and missed bunts count as misses. Fouls, bunt attempts and balls put into play enter the attempt denominator. Both outing and baseline use the same definitions. Called strikes and completed strikeout plate appearances are separate. Chase uses ball-center coordinates outside a 17-inch-wide rectangle and each pitch’s recorded vertical boundaries. Only complete coordinates enter the zone denominator. Savant’s separate zone flag remains in the CSV and detail rather than replacing that geometric definition.
Speed is mph, spin rpm, extension feet and movement inches. Induced vertical break describes movement relative to a gravity-only path. Location and zone boundaries are feet in catcher view. Numbered markers preserve exact coordinates and are not ball size. Release, location, spin, extension and movement measurements are complete for all outing pitches. Contact and expected-outcome measurements can be unavailable and remain missing in the detail and CSV. 3 of 3 balls put into play have measured exit speed. Hard-hit means at least 95 mph; the baseline has 151 measured contacts among 152. Expected outcomes are Savant model estimates, not actual results. The comparisons are descriptive and do not establish intention, fatigue, injury or a durable trend.