
MLB · Pitching Data
Taylor used groundouts to strand the bases loaded in Game 5
Grant Taylor recorded three groundball outs without a miss in his 13-pitch eighth inning. The ledger separates his physical pitches from an intentional walk and tracks the runner inherited from Sean Newcomb.
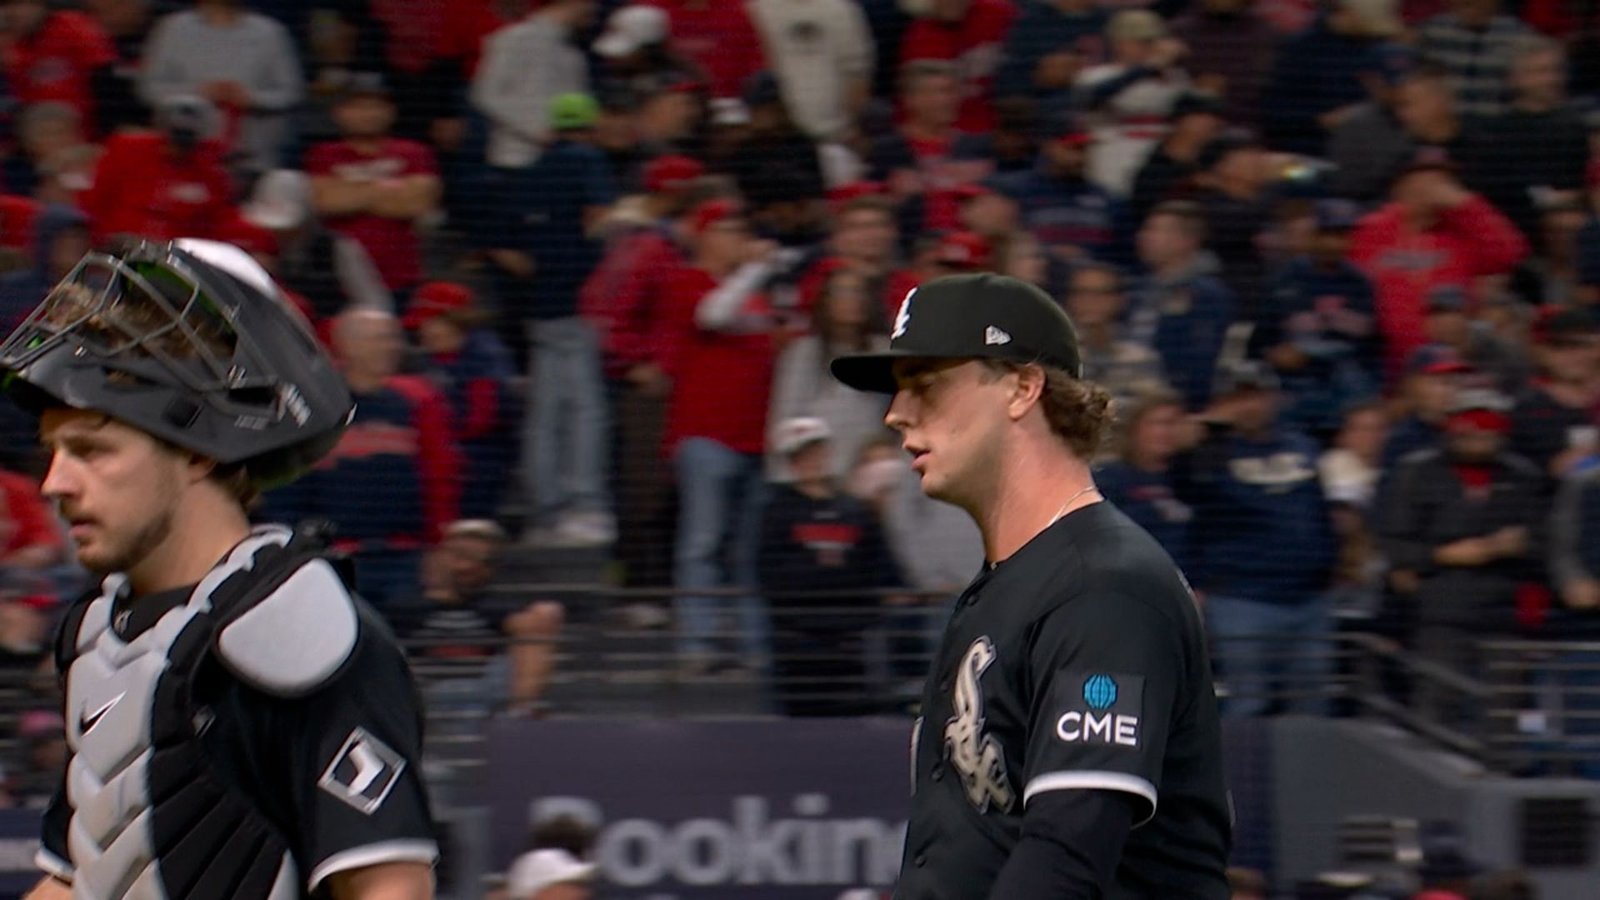
Chase DeLauter hit Grant Taylor’s 82.8 mph curve to first baseman Munetaka Murakami with the bases loaded and one out in the eighth inning. Murakami threw home to retire Petey Halpin. Taylor then obtained a Jo Adell groundout to end the inning, preventing Cleveland from adding to its two-run lead.
Taylor pitched one scoreless inning in Chicago’s 2–0 ALDS Game 5 loss at Progressive Field on October 10. He inherited Halpin at second, faced five batters, issued two walks and threw 13 physical pitches. One of the walks was intentional and involved no physical pitch, a distinction necessary to make the complete ledger agree with the official total.
Unlike his regular-season relief record, this appearance contained no misses. Three balls put into play became three groundball outs. The way Taylor cleared the inning therefore came through contact and defense, after his own walk and an intentional walk expanded the threat beyond the runner he inherited.
Season repertoire and Game 5
Scale: 0–100%. Gray: regular season. Blue: Game 5.
Slider
Change: +29.8 percentage points.
Curveball
Change: -4.6 percentage points.
Four-seam fastball
Change: -20.1 percentage points.
Sinker
Change: -4.8 percentage points.
Cutter
Change: -0.3 percentage points.
Breaking balls carried a short appearance
Taylor threw six sliders, three curves, three four-seamers and one sinker. Sliders made up 46.2% of his pitches, compared with 16.4% in a baseline of 1,272 physical pitches over 56 regular-season relief appearances for Chicago. Four-seamers fell from 43.2% to 23.1%. Thirteen pitches can produce large share changes from only a few choices, so the chart gives counts beside every percentage.
Cleveland made four physical attempts without a miss, compared with a 29.4% whiff rate in Taylor’s season sample. His three four-seamers averaged 99.0 mph, against 98.0 in that baseline, but none drew a swing. Higher measured speed therefore supplied no direct evidence of a fastball miss in this outing.
Taylor obtained three called strikes, two on sliders and one on a curve. The DeLauter confrontation began with a 99.2 mph fastball in the dirt, followed by an 85.1 mph curve for a called strike and the 82.8 mph curve put into play. The resulting forceout depended on where the ball was fielded and the play made at home, not on a strikeout finish.
The three contacts had measured exit speeds of 67.1, 82.0 and 88.7 mph. None met the 95 mph hard-hit threshold, and their average was 79.3. Those are useful observations from three balls, rather than proof of repeatable weak-contact skill. The regular-season sample included 188 contacts, with 187 measured exit speeds, and is much broader than this inning.
Chase DeLauter: inning 8
The inning’s traffic was partly his own
After Brayan Rocchio’s first-pitch groundout moved Halpin to third, Taylor walked Steven Kwan and José Ramírez was intentionally walked. That loaded the bases with one out. Only Halpin was an inherited runner; Kwan and Ramírez reached during Taylor’s appearance. Saying he inherited the bases loaded would misstate the sequence.
DeLauter’s forceout kept the bases loaded with two outs, and Adell grounded to third baseman Miguel Vargas, who threw to Murakami for the final out. All three runners were stranded. The ledger lists the physical pitches against Rocchio, Kwan, DeLauter and Adell, while the intentional walk is recorded separately in the methods so that the fifth batter is not lost.
Taylor’s workload chart contains one inning, with three measured four-seamers, so it cannot show a speed trend across innings. His earlier series appearances required 42 pitches on October 3, seven on October 5 and 18 without an out on October 8. These postseason records are separate from the regular-season relief comparison.
The result demonstrates a successful contact-based escape after Taylor added to the traffic. It does not show that his usual miss-generating repertoire had disappeared. The next useful comparison would ask whether slider-heavy use persists over more batters and whether misses return alongside the favorable contact outcomes observed here.
Inning samples in context
| Inning | Pitches | Cumulative | Four-seam mph | Four-seam n | Outs |
|---|---|---|---|---|---|
| 8 | 13 | 13 | 99.0 | 3 | 3 |
Every pitch: 13 of 13
Search a hitter, select an inning or pitch type, then inspect a pitch number. Pitch result and completed plate-appearance outcome are separate columns. The table scrolls within its border.
13 of 13 pitches
No pitches match these filters.
| Pitch | Inning | Hitter | Count before | Type | mph | Pitch result | Completed PA |
|---|---|---|---|---|---|---|---|
| 8 | Brayan Rocchio | 0–0 | SL | 89.2 | In play, out(s) | Groundout | |
| 8 | Steven Kwan | 0–0 | SI | 99.8 | Ball | Walk | |
| 8 | Steven Kwan | 1–0 | CU | 83.4 | Ball | Walk | |
| 8 | Steven Kwan | 2–0 | SL | 87.9 | Ball | Walk | |
| 8 | Steven Kwan | 3–0 | FF | 98.0 | Ball | Walk | |
| 8 | Chase DeLauter | 0–0 | FF | 99.2 | Ball In Dirt | Forceout | |
| 8 | Chase DeLauter | 1–0 | CU | 85.1 | Called Strike | Forceout | |
| 8 | Chase DeLauter | 1–1 | CU | 82.8 | In play, out(s) | Forceout | |
| 8 | Jo Adell | 0–0 | SL | 89.2 | Called Strike | Groundout | |
| 8 | Jo Adell | 0–1 | SL | 89.5 | Called Strike | Groundout | |
| 8 | Jo Adell | 0–2 | FF | 99.7 | Ball | Groundout | |
| 8 | Jo Adell | 1–2 | SL | 90.4 | Foul | Groundout | |
| 8 | Jo Adell | 1–2 | SL | 89.7 | In play, out(s) | Groundout |
Sources, definitions and limitations
The official final MLB record supplies the score, events, calls and pitching line. Baseball Savant’s complete Game 5 feed supplies all 13 tracked physical pitches. They reconcile by unique ID, order, type, final call and pre-pitch count, including count-changing non-pitch events and challenge decisions. The audit also reconciles 5 batters, 3 integer outs and 0 strikeouts. In baseball innings notation, .1 means one out and .2 means two. Final game and data checked October 11, 2026, before publication.
The Statcast Search baseline is 1,272 pitches in 56 regular-season relief appearances for Chicago White Sox, 2026-03-28 through 2026-09-25. Each game’s pitch total reconciles to the official appearance log. Other roles, other clubs and postseason work are excluded from this baseline.
Whiff rate means misses divided by physical swing attempts. Swinging strikes, blocked swinging strikes, caught foul tips and missed bunts count as misses. Fouls, balls put into play and bunt attempts enter the attempt denominator. Called strikes and completed strikeout plate appearances are separate. José Ramírez’s intentional walk contains no physical pitch and is excluded from the 13-row ledger, while remaining in the official five batters faced and two walks. Chase rate uses ball-center coordinates outside a 17-inch-wide rectangle with each pitch’s recorded vertical zone, divided by pitches outside that rectangle with complete coordinates. Savant’s separate zone flag is retained in the detail and CSV; it is not substituted for this geometric definition.
Speed is mph, spin rpm, extension feet and movement inches. Induced vertical break is relative to a gravity-only trajectory. Plate x/z and zone boundaries are feet in catcher view. Charts preserve exact plate coordinates; markers are not ball size and cannot reveal intended targets. See Statcast field definitions. All outing pitches have the displayed tracking measurements. 3 of 3 balls put into play have measured exit speed. Hard-hit means at least 95 mph; the baseline has 187 measured contacts out of 188. Expected batting average in the details is a Savant model estimate, rather than an actual outcome. Missing values remain missing. These descriptive comparisons do not establish intent, fatigue, injury or a lasting trend.
Sources and notes
- Official MLB final Game 849831: https://statsapi.mlb.com/api/v1.1/game/849831/feed/live
- Baseball Savant complete tracking: https://baseballsavant.mlb.com/gf?game_pk=849831
- Regular-season comparison: 2026-03-28 through 2026-09-25, same club and role.
- Statcast field definitions: https://baseballsavant.mlb.com/csv-docs