
MLB · Pitching Data
Williams’ fastball powered 12 strikeouts before a sixth-inning jam
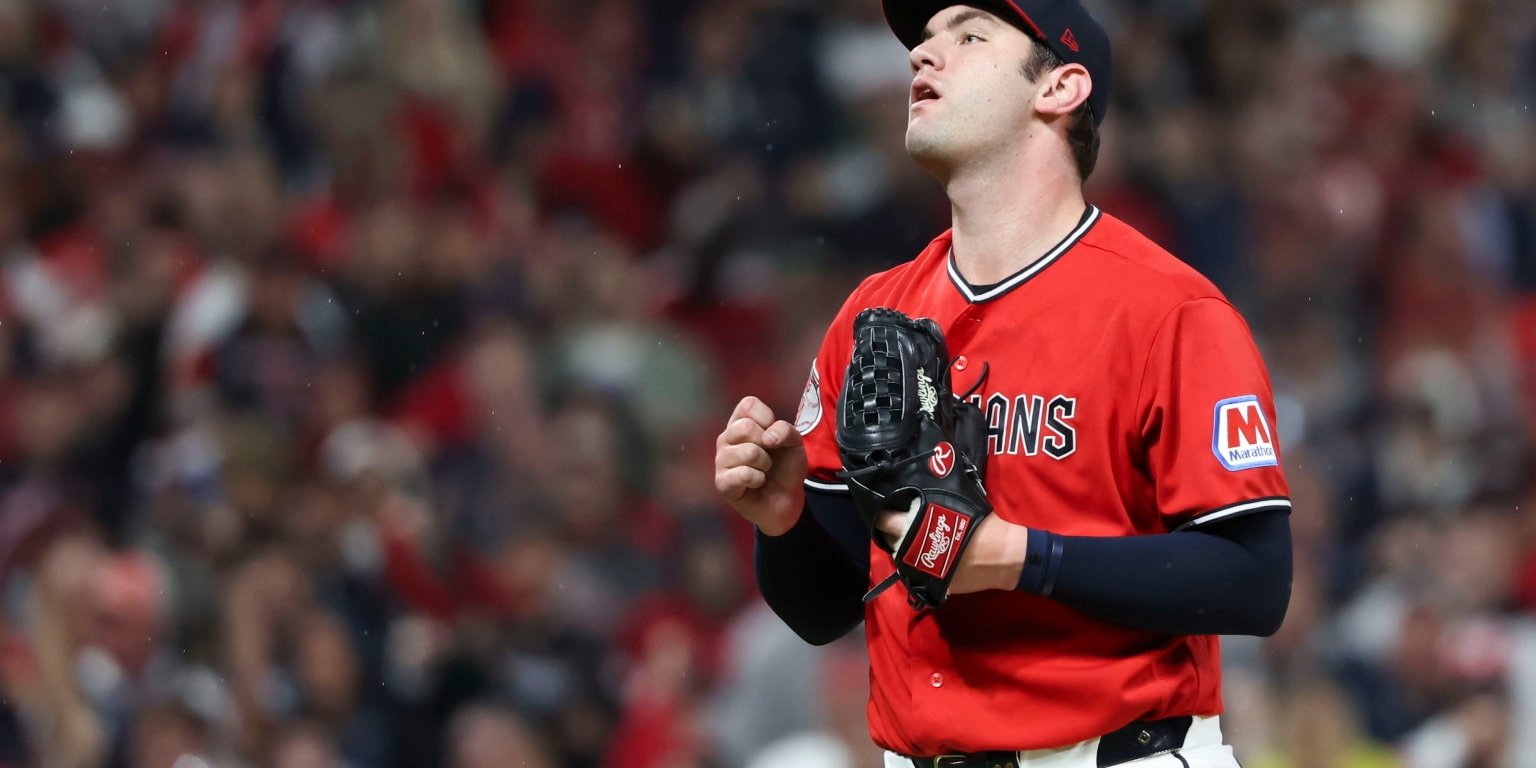
Gavin Williams generated nine misses with a four-seamer averaging 99.1 mph in ALDS Game 5. His complete 94-pitch record also shows how Cleveland’s bullpen became essential to the shutout.
Munetaka Murakami fouled off an 88.5 mph sweeper with two outs in the fourth inning. Gavin Williams followed it with a 100.8 mph four-seam fastball for a called strike, then another four-seamer at 99.9 mph that Murakami missed. The three-pitch strikeout captured the speed of Williams’ fastball and the value of the breaking ball that preceded it.
Williams struck out 12 White Sox over 5⅔ scoreless innings in Cleveland’s 2–0 victory in ALDS Game 5 at Progressive Field on October 10. He allowed one hit, walked two and hit one batter. Cleveland advanced after winning the final three games of the series, but Williams’ outing ended with the bases loaded and a two-run lead still requiring protection.
The fastball supplied his largest source of misses. Chicago swung at 16 of his 24 four-seamers and missed nine. Five of his strikeouts finished on that pitch. The rest of the outing shows why those results should be read alongside his breaking balls, his unusually frequent empty swings and the traffic that accumulated in the sixth.
Season repertoire and Game 5
Scale: 0–100%. Gray: regular season. Blue: Game 5.
Knuckle curve
Change: +9.7 percentage points.
Sweeper
Change: +2.4 percentage points.
Four-seam fastball
Change: -1.5 percentage points.
Sinker
Change: -3.7 percentage points.
Cutter
Change: -5.8 percentage points.
Unclassified
Change: -1.0 percentage points.
More speed, with four ways to finish a hitter
The comparison is Williams’ 2,991 physical pitches in 32 regular-season starts for Cleveland, ending before this game. His four-seamer averaged 99.1 mph on Saturday, compared with 97.6 mph in those starts. Its share barely changed, moving from 27.0% to 25.5%. The prominent difference was the speed and the response to the pitch, rather than a large increase in how often he threw it.
Williams threw 30 knuckle curves, 29 sweepers and 11 sinkers alongside those four-seamers. The knuckle curve increased from 22.2% of his regular-season pitches to 31.9%, while the sweeper moved from 28.5% to 30.9%. All four classifications produced misses and all four finished strikeouts: five on four-seamers, three on sweepers, three on knuckle curves and one on a sinker.
That spread matters because a strikeout is the outcome of a plate appearance, while a miss is the outcome of an individual attempt. Williams had 22 misses in 50 swing attempts, a 44.0% whiff rate against 32.8% in his regular-season starts. The four-seamer accounted for nine of those misses, the sweeper six, the knuckle curve four and the sinker three. A two-strike miss cannot automatically be counted as a completed strikeout.
The Murakami sequence gave Chicago a large speed change within a short confrontation. Its opening sweeper was 12.3 mph slower than the next fastball. The pitch diagram shows where each ball crossed the plate; it does not establish Murakami’s expectation or the catcher’s intended target. The first fastball was taken and the second was missed, so the finish depended on different ways of acquiring strikes.
Williams’ four-seamer averaged 15.0 inches of induced vertical break, against 14.5 in the regular-season comparison. This measure describes movement relative to a gravity-only path, rather than a ball physically rising. The modest difference in that average should not displace the more direct evidence: the pitch was faster, and nine of the 16 attempts against it failed to make contact.
Chicago also chased 26 of 58 pitches outside the defined ball-center strike-zone rectangle, or 44.8%. The comparable regular-season rate was 37.4%. Both samples use the same geometric rule and exclude pitches with missing zone coordinates. That is evidence of more attempts at pitches beyond the recorded rectangle in this game; it cannot show whether Williams deliberately expanded a target.
Munetaka Murakami: inning 4
The sixth required a different kind of escape
Chicago made contact with only six balls put into play against Williams, and Kyle Teel’s sixth-inning single was its first hit. That does not mean every earlier contact was weak. Sam Antonacci’s first-inning lineout left the bat at 101.3 mph, and Miguel Vargas’ groundout was measured at 96.7. Two of the six contacts met the 95 mph hard-hit threshold, while the average exit speed was 91.3 mph.
Williams needed 51 pitches for the first four innings, then 21 in the fifth and 22 in his incomplete sixth. His average four-seam speed was 98.9 mph in the fifth and 98.7 in the sixth, based on five and four pitches respectively. Both remained above his season average. Those small inning samples describe the recorded speeds, without establishing fatigue or a physical problem.
The sixth began with Colson Montgomery being hit by a pitch. Williams struck out Brenton Doyle and retired Antonacci, but Teel singled and Vargas walked. That left three runners aboard with two outs. Erik Sabrowski replaced Williams and struck out Murakami on a foul tip, resolving the inherited runners and preserving Williams’ scoreless line.
Williams had already thrown 98 pitches in his Game 2 start on October 5, when he struck out 11 over five innings, and 18 pitches in a one-inning Game 4 relief appearance on October 8. Those postseason appearances are separate from the regular-season baseline. They supply recent workload context, not proof that his sixth-inning difficulties had a particular cause.
The complete record supports a specific conclusion: Williams paired a faster four-seamer with multiple useful breaking-ball finishes and generated far more misses than his season comparison. It also shows an outing that needed a reliever to clear its final threat. In another start, the useful test would be whether the same speed and swing response persist through later innings while he limits free baserunners.
Inning samples in context
| Inning | Pitches | Cumulative | Four-seam mph | Four-seam n | Outs |
|---|---|---|---|---|---|
| 1 | 7 | 7 | 99.0 | 3 | 3 |
| 2 | 17 | 24 | 99.5 | 4 | 3 |
| 3 | 14 | 38 | 99.0 | 4 | 3 |
| 4 | 13 | 51 | 99.4 | 4 | 3 |
| 5 | 21 | 72 | 98.9 | 5 | 3 |
| 6* | 22 | 94 | 98.7 | 4 | 2 |
Every pitch: 94 of 94
Search a hitter, select an inning or pitch type, then inspect a pitch number. Pitch result and completed plate-appearance outcome are separate columns. The table scrolls within its border.
94 of 94 pitches
No pitches match these filters.
| Pitch | Inning | Hitter | Count before | Type | mph | Pitch result | Completed PA |
|---|---|---|---|---|---|---|---|
| 1 | Sam Antonacci | 0–0 | FF | 97.8 | Ball | Lineout | |
| 1 | Sam Antonacci | 1–0 | KC | 81.2 | Ball | Lineout | |
| 1 | Sam Antonacci | 2–0 | SI | 97.7 | In play, out(s) | Lineout | |
| 1 | Kyle Teel | 0–0 | KC | 81.9 | Called Strike | Strikeout | |
| 1 | Kyle Teel | 0–1 | FF | 99.6 | Swinging Strike | Strikeout | |
| 1 | Kyle Teel | 0–2 | FF | 99.5 | Foul Tip | Strikeout | |
| 1 | Miguel Vargas | 0–0 | KC | 83.6 | In play, out(s) | Groundout | |
| 2 | Munetaka Murakami | 0–0 | ST | 87.1 | Called Strike | Strikeout | |
| 2 | Munetaka Murakami | 0–1 | FF | 98.7 | Swinging Strike | Strikeout | |
| 2 | Munetaka Murakami | 0–2 | FF | 98.9 | Ball | Strikeout | |
| 2 | Munetaka Murakami | 1–2 | ST | 87.5 | Ball | Strikeout | |
| 2 | Munetaka Murakami | 2–2 | FF | 99.5 | Foul | Strikeout | |
| 2 | Munetaka Murakami | 2–2 | ST | 89.5 | Swinging Strike | Strikeout | |
| 2 | Andrew Benintendi | 0–0 | SI | 100.1 | Called Strike | Strikeout | |
| 2 | Andrew Benintendi | 0–1 | SI | 99.9 | Swinging Strike | Strikeout | |
| 2 | Andrew Benintendi | 0–2 | FF | 100.7 | Swinging Strike | Strikeout | |
| 2 | Tristan Peters | 0–0 | ST | 89.2 | Called Strike | Walk | |
| 2 | Tristan Peters | 0–1 | KC | 83.8 | Ball | Walk | |
| 2 | Tristan Peters | 1–1 | KC | 81.1 | Ball | Walk | |
| 2 | Tristan Peters | 2–1 | ST | 88.2 | Ball | Walk | |
| 2 | Tristan Peters | 3–1 | SI | 99.5 | Ball | Walk | |
| 2 | Chase Meidroth | 0–0 | ST | 87.8 | Called Strike | Strikeout | |
| 2 | Chase Meidroth | 0–1 | ST | 89.5 | Swinging Strike | Strikeout | |
| 2 | Chase Meidroth | 0–2 | ST | 88.9 | Swinging Strike | Strikeout | |
| 3 | Colson Montgomery | 0–0 | KC | 80.9 | Ball | Strikeout | |
| 3 | Colson Montgomery | 1–0 | FF | 99.0 | Ball | Strikeout | |
| 3 | Colson Montgomery | 2–0 | FF | 98.4 | Swinging Strike | Strikeout | |
| 3 | Colson Montgomery | 2–1 | ST | 86.0 | Called Strike | Strikeout | |
| 3 | Colson Montgomery | 2–2 | FF | 98.7 | Foul | Strikeout | |
| 3 | Colson Montgomery | 2–2 | KC | 83.3 | Swinging Strike | Strikeout | |
| 3 | Brenton Doyle | 0–0 | ST | 87.9 | Foul | Strikeout | |
| 3 | Brenton Doyle | 0–1 | KC | 82.3 | Called Strike | Strikeout | |
| 3 | Brenton Doyle | 0–2 | ST | 88.8 | Ball | Strikeout | |
| 3 | Brenton Doyle | 1–2 | FF | 99.7 | Foul | Strikeout | |
| 3 | Brenton Doyle | 1–2 | KC | 82.9 | Swinging Strike | Strikeout | |
| 3 | Sam Antonacci | 0–0 | KC | 81.5 | Foul | Groundout | |
| 3 | Sam Antonacci | 0–1 | KC | 83.0 | Ball | Groundout | |
| 3 | Sam Antonacci | 1–1 | ST | 87.7 | In play, out(s) | Groundout | |
| 4 | Kyle Teel | 0–0 | FF | 97.8 | Ball | Strikeout | |
| 4 | Kyle Teel | 1–0 | ST | 86.0 | Swinging Strike | Strikeout | |
| 4 | Kyle Teel | 1–1 | ST | 86.2 | Called Strike | Strikeout | |
| 4 | Kyle Teel | 1–2 | KC | 83.6 | Called Strike | Strikeout | |
| 4 | Miguel Vargas | 0–0 | KC | 81.7 | Ball | Strikeout | |
| 4 | Miguel Vargas | 1–0 | FF | 99.1 | Swinging Strike | Strikeout | |
| 4 | Miguel Vargas | 1–1 | ST | 88.8 | Ball | Strikeout | |
| 4 | Miguel Vargas | 2–1 | KC | 83.0 | Foul Tip | Strikeout | |
| 4 | Miguel Vargas | 2–2 | ST | 89.4 | Ball | Strikeout | |
| 4 | Miguel Vargas | 3–2 | SI | 99.3 | Called Strike | Strikeout | |
| 4 | Munetaka Murakami | 0–0 | ST | 88.5 | Foul | Strikeout | |
| 4 | Munetaka Murakami | 0–1 | FF | 100.8 | Called Strike | Strikeout | |
| 4 | Munetaka Murakami | 0–2 | FF | 99.9 | Swinging Strike | Strikeout | |
| 5 | Andrew Benintendi | 0–0 | KC | 81.9 | Ball | Strikeout | |
| 5 | Andrew Benintendi | 1–0 | ST | 86.5 | Foul | Strikeout | |
| 5 | Andrew Benintendi | 1–1 | SI | 97.9 | Swinging Strike | Strikeout | |
| 5 | Andrew Benintendi | 1–2 | KC | 83.0 | Ball | Strikeout | |
| 5 | Andrew Benintendi | 2–2 | SI | 98.9 | Foul | Strikeout | |
| 5 | Andrew Benintendi | 2–2 | KC | 83.0 | Foul | Strikeout | |
| 5 | Andrew Benintendi | 2–2 | ST | 88.4 | Swinging Strike | Strikeout | |
| 5 | Tristan Peters | 0–0 | KC | 81.8 | Called Strike | Groundout | |
| 5 | Tristan Peters | 0–1 | FF | 98.4 | Ball | Groundout | |
| 5 | Tristan Peters | 1–1 | FF | 98.8 | Called Strike | Groundout | |
| 5 | Tristan Peters | 1–2 | FF | 99.7 | Foul | Groundout | |
| 5 | Tristan Peters | 1–2 | KC | 83.7 | Foul | Groundout | |
| 5 | Tristan Peters | 1–2 | ST | 88.8 | Foul | Groundout | |
| 5 | Tristan Peters | 1–2 | SI | 99.4 | In play, out(s) | Groundout | |
| 5 | Chase Meidroth | 0–0 | FF | 98.7 | Foul | Strikeout | |
| 5 | Chase Meidroth | 0–1 | KC | 83.6 | Foul | Strikeout | |
| 5 | Chase Meidroth | 0–2 | KC | 84.3 | Ball | Strikeout | |
| 5 | Chase Meidroth | 1–2 | KC | 84.2 | Ball | Strikeout | |
| 5 | Chase Meidroth | 2–2 | SI | 98.6 | Foul | Strikeout | |
| 5 | Chase Meidroth | 2–2 | ST | 88.9 | Foul | Strikeout | |
| 5 | Chase Meidroth | 2–2 | FF | 99.1 | Foul Tip | Strikeout | |
| 6 | Colson Montgomery | 0–0 | KC | 81.1 | Swinging Strike | Hit By Pitch | |
| 6 | Colson Montgomery | 0–1 | ST | 87.0 | Swinging Strike | Hit By Pitch | |
| 6 | Colson Montgomery | 0–2 | ST | 88.0 | Hit By Pitch | Hit By Pitch | |
| 6 | Brenton Doyle | 0–0 | KC | 82.3 | Ball In Dirt | Strikeout | |
| 6 | Brenton Doyle | 1–0 | ST | 87.3 | Ball In Dirt | Strikeout | |
| 6 | Brenton Doyle | 2–0 | SI | 97.3 | Foul | Strikeout | |
| 6 | Brenton Doyle | 2–1 | SI | 97.2 | Swinging Strike | Strikeout | |
| 6 | Brenton Doyle | 2–2 | FF | 98.0 | Swinging Strike | Strikeout | |
| 6 | Sam Antonacci | 0–0 | ST | 86.5 | Called Strike | Flyout | |
| 6 | Sam Antonacci | 0–1 | ST | 87.5 | Foul | Flyout | |
| 6 | Sam Antonacci | 0–2 | KC | 83.6 | Ball In Dirt | Flyout | |
| 6 | Sam Antonacci | 1–2 | KC | 83.0 | Foul | Flyout | |
| 6 | Sam Antonacci | 1–2 | ST | 88.0 | Foul | Flyout | |
| 6 | Sam Antonacci | 1–2 | FF | 98.1 | Foul | Flyout | |
| 6 | Sam Antonacci | 1–2 | KC | 81.3 | In play, out(s) | Flyout | |
| 6 | Kyle Teel | 0–0 | FF | 99.0 | Foul | Single | |
| 6 | Kyle Teel | 0–1 | KC | 82.4 | In play, no out | Single | |
| 6 | Miguel Vargas | 0–0 | ST | 88.9 | Ball | Walk | |
| 6 | Miguel Vargas | 1–0 | KC | 84.2 | Ball In Dirt | Walk | |
| 6 | Miguel Vargas | 2–0 | KC | 82.7 | Ball | Walk | |
| 6 | Miguel Vargas | 3–0 | ST | 89.6 | Called Strike | Walk | |
| 6 | Miguel Vargas | 3–1 | FF | 99.6 | Ball | Walk |
Sources, definitions and limitations
The official final MLB record supplies the score, events, calls and pitching line. Baseball Savant’s complete Game 5 feed supplies all 94 tracked physical pitches. They reconcile by unique ID, order, type, final call and pre-pitch count, including count-changing non-pitch events and challenge decisions. The audit also reconciles 21 batters, 17 integer outs and 12 strikeouts. In baseball innings notation, .1 means one out and .2 means two. Final game and data checked October 11, 2026, before publication.
The Statcast Search baseline is 2,991 pitches in 32 regular-season starter appearances for Cleveland Guardians, 2026-03-27 through 2026-09-25. Each game’s pitch total reconciles to the official appearance log. Other roles, other clubs and postseason work are excluded from this baseline. 31 baseline pitches lack start speed; excluded from that measure. 31 baseline pitches lack spin rate; excluded from that measure. 31 baseline pitches lack extension; excluded from that measure. 31 baseline pitches lack plate x; excluded from that measure. 31 baseline pitches lack plate z; excluded from that measure.
Whiff rate means misses divided by physical swing attempts. Swinging strikes, blocked swinging strikes, caught foul tips and missed bunts count as misses. Fouls, balls put into play and bunt attempts enter the attempt denominator. Called strikes and completed strikeout plate appearances are separate. Chase rate uses ball-center coordinates outside a 17-inch-wide rectangle with each pitch’s recorded vertical zone, divided by pitches outside that rectangle with complete coordinates. Savant’s separate zone flag is retained in the detail and CSV; it is not substituted for this geometric definition.
Speed is mph, spin rpm, extension feet and movement inches. Induced vertical break is relative to a gravity-only trajectory. Plate x/z and zone boundaries are feet in catcher view. Charts preserve exact plate coordinates; markers are not ball size and cannot reveal intended targets. See Statcast field definitions. All outing pitches have the displayed tracking measurements. 6 of 6 balls put into play have measured exit speed. Hard-hit means at least 95 mph; the baseline has 431 measured contacts out of 431. Expected batting average in the details is a Savant model estimate, rather than an actual outcome. Missing values remain missing. These descriptive comparisons do not establish intent, fatigue, injury or a lasting trend.
Sources and notes
- Official MLB final Game 849831: https://statsapi.mlb.com/api/v1.1/game/849831/feed/live
- Baseball Savant complete tracking: https://baseballsavant.mlb.com/gf?game_pk=849831
- Regular-season comparison: 2026-03-27 through 2026-09-25, same club and role.
- Statcast field definitions: https://baseballsavant.mlb.com/csv-docs