
MLB · Pitching Data
Burke increased his cutter use, but Ramírez punished a low curve
Sean Burke’s cutter share rose to 25.4% in ALDS Game 5. His 71-pitch record explains the called strikes, limited misses and unusually low knuckle curve that produced Cleveland’s only runs.

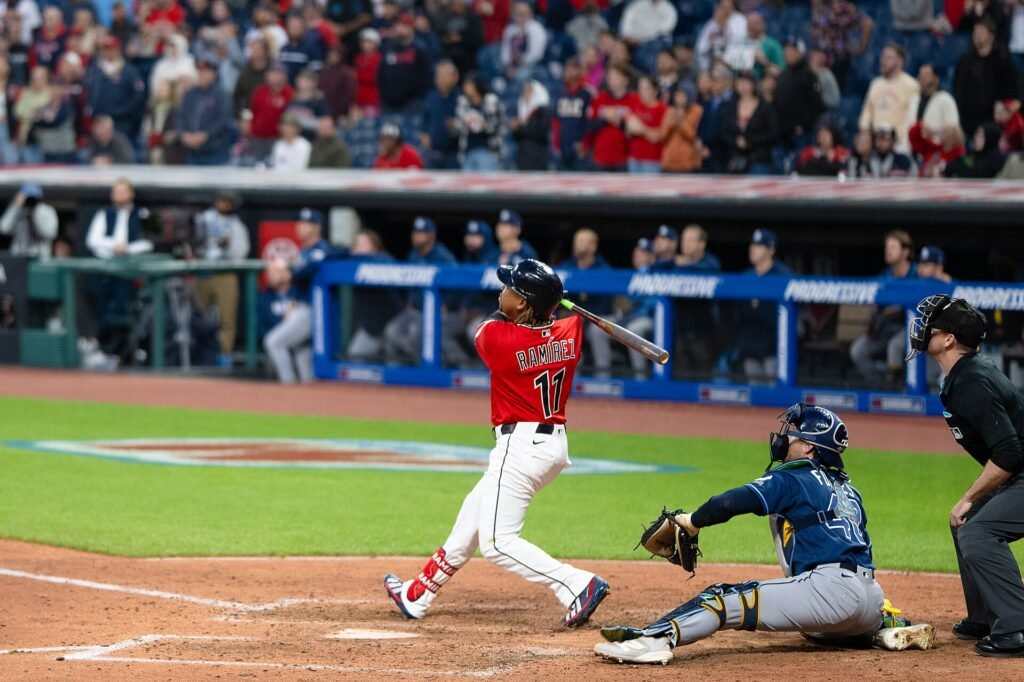
Sean Burke reached a 2–2 count against José Ramírez in the fourth inning with two called strikes on cutters. His next pitch was a 78.0 mph knuckle curve that crossed the plate just 0.74 feet above the ground. Ramírez hit it for a two-run homer, turning a pitch far below his recorded strike-zone floor into the only scoring play of ALDS Game 5.
Burke allowed four hits and two runs over five innings in the White Sox’s 2–0 loss to Cleveland at Progressive Field on October 10. He struck out four, walked nobody and threw 71 pitches. Chicago’s season ended even though Burke prevented another run and its two relievers completed three scoreless innings.
The outing’s broader pattern was a heavier reliance on cutters and a smaller supply of misses than in his regular-season starts. The cutter helped him acquire called strikes, including those two against Ramírez. The decisive homer came on a different pitch, and the complete contact record complicates any explanation that treats one mistake as the quality of the entire start.
Season repertoire and Game 5
Scale: 0–100%. Gray: regular season. Blue: Game 5.
Four-seam fastball
Change: -4.5 percentage points.
Cutter
Change: +14.9 percentage points.
Knuckle curve
Change: -2.1 percentage points.
Slider
Change: -1.8 percentage points.
Sinker
Change: -4.9 percentage points.
Changeup
Change: -1.6 percentage points.
The cutter found taken strikes
Burke threw 18 cutters, or 25.4% of his pitches, against 10.4% in a baseline of 2,445 physical pitches across 27 regular-season starts for Chicago. That was an increase of 14.9 percentage points using the unrounded shares. He also threw 23 four-seam fastballs, 13 knuckle curves, 11 sliders and six sinkers. Every pitch remains in the comparison, including the less frequent classifications.
Five of those cutters were called strikes, and none of the eight attempts against the pitch produced a miss. That is a meaningful distinction in its contribution. A taken strike can move an at-bat forward without creating an empty swing, but the absence of misses meant Burke still depended on other pitches and on balls being converted into outs.
His slider generated three misses in five attempts, and his four-seamer generated two in 15. Overall he had five misses in 34 physical attempts, a 14.7% whiff rate compared with 24.5% in the season baseline. This count includes Steven Kwan’s foul bunt. Savant’s outing summary excludes that attempt and lists 33 swings, producing 15.2%; the miss count is five under either denominator.
The opponent’s handedness mix differed substantially from Burke’s season sample. He threw 62 of 71 pitches to left-handed hitters, compared with 1,419 of 2,445 in the baseline. Even within that left-handed split, cutters rose from 191 of 1,419 pitches, or 13.5%, to 16 of 62, or 25.8%. The observed increase therefore extends beyond the overall hitter mix, although a single game cannot establish a permanent change in his plan.
His four-seamer averaged 94.9 mph, close to its 94.7 mph season mark. The cutter averaged 89.4 against 89.8, with 8.8 inches of induced vertical break against 9.0. These averages do not suggest a large cutter shape or speed change. The clearer difference was how often Burke used it and how the resulting strikes were acquired.
Against Ramírez, the sequence began with a knuckle curve for a ball, then alternated a cutter strike, a slider ball and a second cutter strike. The fifth pitch returned to the knuckle curve. Its plate height was roughly 0.79 feet below Ramírez’s recorded 1.53-foot zone floor. Ramírez made damaging contact outside the recorded rectangle. That location alone cannot establish whether Burke missed an intended target.
José Ramírez: inning 4
One low pitch within a mixed contact record
Ramírez’s homer had a measured exit speed of 97.2 mph. The fact that it was low does not establish that Burke missed a target: the public tracking record supplies the ball’s path and outcome, not the intended location. Nor does an isolated homer prove that every low knuckle curve was ineffective. Burke’s other results need to stay in the account.
Cleveland put 14 balls into play against him. All had measured exit speeds, averaging 85.1 mph, and four reached at least 95 mph. Those figures were below his season comparison of 88.7 mph and a 39.1% hard-hit rate. Yet the first-inning lineout by Chase DeLauter was measured at 109.2 mph. That hard contact became an out, while other, much softer contacts became hits.
Jo Adell’s fourth-inning single left the bat at just 43.9 mph. Petey Halpin later doubled at 93.5 mph in the fifth, then was retired attempting to advance to third on the play. That baserunning out helped Burke finish the inning. The final line therefore reflects both his pitching and what happened after contact, rather than an uninterrupted series of routine outs.
Burke’s longest inning was the fourth, when he threw 22 pitches; the other four required nine, 10, 15 and 15. His inning-level four-seam averages ranged from 94.7 to 95.4 mph. There is no sustained decline in that small set of measurements, and the chart does not use those speeds to diagnose fatigue.
His previous appearance in the series was an 83-pitch relief outing over 5⅓ innings in Game 2 on October 5. That role differed from this start, so it is identified separately from the matching-role regular-season baseline. The Game 5 record shows a cutter gaining prominence and collecting called strikes, but it leaves a practical question for the next outing: can the heavier cutter mix coexist with more misses from the rest of the repertoire?
Inning samples in context
| Inning | Pitches | Cumulative | Four-seam mph | Four-seam n | Outs |
|---|---|---|---|---|---|
| 1 | 9 | 9 | 94.7 | 4 | 3 |
| 2 | 10 | 19 | 95.4 | 3 | 3 |
| 3 | 15 | 34 | 95.2 | 3 | 3 |
| 4 | 22 | 56 | 94.7 | 7 | 3 |
| 5 | 15 | 71 | 94.7 | 6 | 3 |
Every pitch: 71 of 71
Search a hitter, select an inning or pitch type, then inspect a pitch number. Pitch result and completed plate-appearance outcome are separate columns. The table scrolls within its border.
71 of 71 pitches
No pitches match these filters.
| Pitch | Inning | Hitter | Count before | Type | mph | Pitch result | Completed PA |
|---|---|---|---|---|---|---|---|
| 1 | Steven Kwan | 0–0 | SI | 93.6 | Ball | Flyout | |
| 1 | Steven Kwan | 1–0 | FF | 93.9 | Called Strike | Flyout | |
| 1 | Steven Kwan | 1–1 | FC | 91.4 | In play, out(s) | Flyout | |
| 1 | José Ramírez | 0–0 | KC | 75.4 | Called Strike | Flyout | |
| 1 | José Ramírez | 0–1 | FF | 95.5 | In play, out(s) | Flyout | |
| 1 | Chase DeLauter | 0–0 | KC | 76.9 | Ball | Lineout | |
| 1 | Chase DeLauter | 1–0 | FF | 94.0 | Foul | Lineout | |
| 1 | Chase DeLauter | 1–1 | FF | 95.5 | Ball | Lineout | |
| 1 | Chase DeLauter | 2–1 | FC | 91.4 | In play, out(s) | Lineout | |
| 2 | Jo Adell | 0–0 | SL | 86.3 | Called Strike | Pop Out | |
| 2 | Jo Adell | 0–1 | SL | 86.5 | Swinging Strike | Pop Out | |
| 2 | Jo Adell | 0–2 | SL | 86.3 | Ball | Pop Out | |
| 2 | Jo Adell | 1–2 | SL | 87.1 | In play, out(s) | Pop Out | |
| 2 | Nathaniel Lowe | 0–0 | FF | 94.9 | Called Strike | Groundout | |
| 2 | Nathaniel Lowe | 0–1 | FF | 95.0 | In play, out(s) | Groundout | |
| 2 | Travis Bazzana | 0–0 | FC | 89.4 | Foul | Strikeout | |
| 2 | Travis Bazzana | 0–1 | KC | 77.8 | Foul | Strikeout | |
| 2 | Travis Bazzana | 0–2 | FC | 87.0 | Ball | Strikeout | |
| 2 | Travis Bazzana | 1–2 | FF | 96.4 | Swinging Strike | Strikeout | |
| 3 | Patrick Bailey | 0–0 | FC | 88.8 | In play, out(s) | Groundout | |
| 3 | Petey Halpin | 0–0 | KC | 75.2 | Called Strike | Groundout | |
| 3 | Petey Halpin | 0–1 | FC | 91.6 | Ball | Groundout | |
| 3 | Petey Halpin | 1–1 | FC | 90.1 | Called Strike | Groundout | |
| 3 | Petey Halpin | 1–2 | FF | 95.3 | Ball | Groundout | |
| 3 | Petey Halpin | 2–2 | FF | 93.8 | Ball | Groundout | |
| 3 | Petey Halpin | 3–2 | FC | 91.9 | Foul | Groundout | |
| 3 | Petey Halpin | 3–2 | SI | 95.6 | In play, out(s) | Groundout | |
| 3 | Brayan Rocchio | 0–0 | SI | 95.7 | Ball | Strikeout | |
| 3 | Brayan Rocchio | 1–0 | SL | 87.4 | Ball | Strikeout | |
| 3 | Brayan Rocchio | 2–0 | KC | 76.6 | Called Strike | Strikeout | |
| 3 | Brayan Rocchio | 2–1 | KC | 76.4 | Called Strike | Strikeout | |
| 3 | Brayan Rocchio | 2–2 | FF | 96.6 | Foul | Strikeout | |
| 3 | Brayan Rocchio | 2–2 | KC | 78.8 | Foul | Strikeout | |
| 3 | Brayan Rocchio | 2–2 | SL | 87.4 | Swinging Strike (Blocked) | Strikeout | |
| 4 | Steven Kwan | 0–0 | FF | 93.0 | Foul Bunt | Single | |
| 4 | Steven Kwan | 0–1 | KC | 77.4 | In play, no out | Single | |
| 4 | José Ramírez | 0–0 | KC | 75.7 | Ball | Home Run | |
| 4 | José Ramírez | 1–0 | FC | 88.9 | Called Strike | Home Run | |
| 4 | José Ramírez | 1–1 | SL | 86.9 | Ball | Home Run | |
| 4 | José Ramírez | 2–1 | FC | 89.1 | Called Strike | Home Run | |
| 4 | José Ramírez | 2–2 | KC | 78.0 | In play, run(s) | Home Run | |
| 4 | Chase DeLauter | 0–0 | SI | 94.3 | Ball | Flyout | |
| 4 | Chase DeLauter | 1–0 | FF | 95.8 | Foul | Flyout | |
| 4 | Chase DeLauter | 1–1 | KC | 79.1 | Ball | Flyout | |
| 4 | Chase DeLauter | 2–1 | FF | 95.2 | In play, out(s) | Flyout | |
| 4 | Jo Adell | 0–0 | FF | 94.8 | Foul | Single | |
| 4 | Jo Adell | 0–1 | FC | 87.3 | Called Strike | Single | |
| 4 | Jo Adell | 0–2 | FC | 87.6 | Ball | Single | |
| 4 | Jo Adell | 1–2 | FF | 96.2 | Ball | Single | |
| 4 | Jo Adell | 2–2 | SI | 94.6 | In play, no out | Single | |
| 4 | Nathaniel Lowe | 0–0 | KC | 77.3 | Ball | Pop Out | |
| 4 | Nathaniel Lowe | 1–0 | FF | 93.3 | In play, out(s) | Pop Out | |
| 4 | Travis Bazzana | 0–0 | FC | 89.9 | Foul | Strikeout | |
| 4 | Travis Bazzana | 0–1 | FF | 94.8 | Foul | Strikeout | |
| 4 | Travis Bazzana | 0–2 | SL | 86.6 | Ball | Strikeout | |
| 4 | Travis Bazzana | 1–2 | SL | 86.8 | Swinging Strike | Strikeout | |
| 5 | Patrick Bailey | 0–0 | SI | 93.4 | Called Strike | Groundout | |
| 5 | Patrick Bailey | 0–1 | FC | 91.3 | Ball | Groundout | |
| 5 | Patrick Bailey | 1–1 | FC | 87.2 | Ball | Groundout | |
| 5 | Patrick Bailey | 2–1 | FC | 88.4 | Called Strike | Groundout | |
| 5 | Patrick Bailey | 2–2 | FF | 93.5 | Foul | Groundout | |
| 5 | Patrick Bailey | 2–2 | SL | 87.4 | In play, out(s) | Groundout | |
| 5 | Petey Halpin | 0–0 | FF | 94.5 | Ball | Double | |
| 5 | Petey Halpin | 1–0 | FC | 87.7 | Foul | Double | |
| 5 | Petey Halpin | 1–1 | FF | 94.7 | Foul | Double | |
| 5 | Petey Halpin | 1–2 | FF | 95.8 | Ball | Double | |
| 5 | Petey Halpin | 2–2 | FC | 90.0 | In play, out(s) | Double | |
| 5 | Brayan Rocchio | 0–0 | KC | 75.5 | Called Strike | Strikeout | |
| 5 | Brayan Rocchio | 0–1 | FF | 95.6 | Foul | Strikeout | |
| 5 | Brayan Rocchio | 0–2 | SL | 87.3 | Ball | Strikeout | |
| 5 | Brayan Rocchio | 1–2 | FF | 94.3 | Swinging Strike | Strikeout |
Sources, definitions and limitations
The official final MLB record supplies the score, events, calls and pitching line. Baseball Savant’s complete Game 5 feed supplies all 71 tracked physical pitches. They reconcile by unique ID, order, type, final call and pre-pitch count, including count-changing non-pitch events and challenge decisions. The audit also reconciles 18 batters, 15 integer outs and 4 strikeouts. In baseball innings notation, .1 means one out and .2 means two. Final game and data checked October 11, 2026, before publication. MLB marks one swinging strike as blocked; Savant’s human-readable label omits “Blocked,” while its machine call preserves it. The table and detail use the official final call.
The Statcast Search baseline is 2,445 pitches in 27 regular-season starter appearances for Chicago White Sox, 2026-03-28 through 2026-09-25. Each game’s pitch total reconciles to the official appearance log. Other roles, other clubs and postseason work are excluded from this baseline.
Whiff rate means misses divided by physical swing attempts. Swinging strikes, blocked swinging strikes, caught foul tips and missed bunts count as misses. Fouls, balls put into play and bunt attempts enter the attempt denominator. Called strikes and completed strikeout plate appearances are separate. The physical-attempt denominator includes one foul bunt: 34 attempts versus 33 swings in Savant’s summary. Misses reconcile under both definitions. Chase rate uses ball-center coordinates outside a 17-inch-wide rectangle with each pitch’s recorded vertical zone, divided by pitches outside that rectangle with complete coordinates. Savant’s separate zone flag is retained in the detail and CSV; it is not substituted for this geometric definition.
Speed is mph, spin rpm, extension feet and movement inches. Induced vertical break is relative to a gravity-only trajectory. Plate x/z and zone boundaries are feet in catcher view. Charts preserve exact plate coordinates; markers are not ball size and cannot reveal intended targets. See Statcast field definitions. All outing pitches have the displayed tracking measurements. 14 of 14 balls put into play have measured exit speed. Hard-hit means at least 95 mph; the baseline has 384 measured contacts out of 385. Expected batting average in the details is a Savant model estimate, rather than an actual outcome. Missing values remain missing. These descriptive comparisons do not establish intent, fatigue, injury or a lasting trend.
Sources and notes
- Official MLB final Game 849831: https://statsapi.mlb.com/api/v1.1/game/849831/feed/live
- Baseball Savant complete tracking: https://baseballsavant.mlb.com/gf?game_pk=849831
- Regular-season comparison: 2026-03-28 through 2026-09-25, same club and role.
- Statcast field definitions: https://baseballsavant.mlb.com/csv-docs