
MLB
Jake Bauers, Pitch by Pitch: The 11-Pitch Homer and 12-Pitch Walk
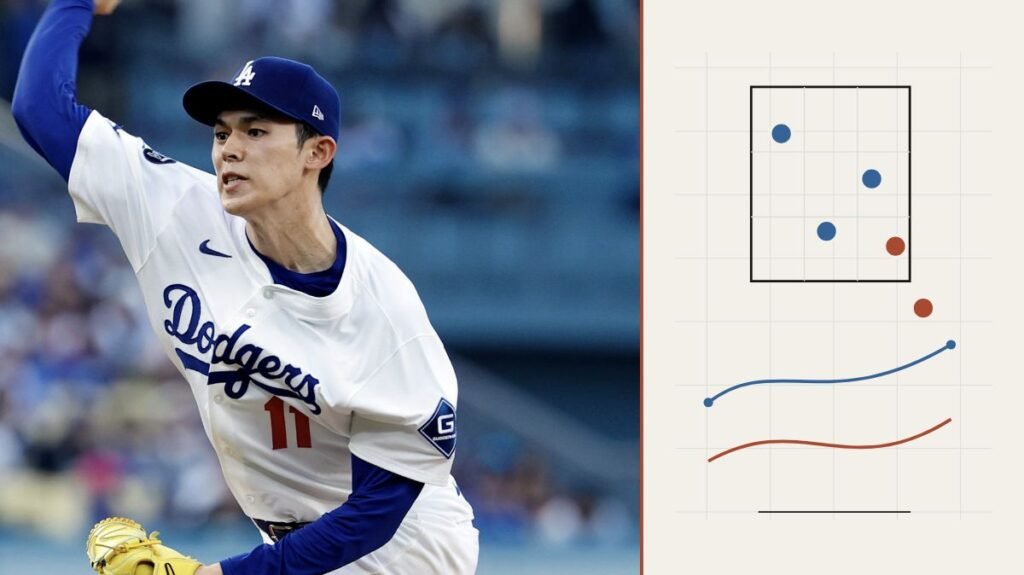
An 11-pitch home run against Blake Snell followed a 12-pitch walk against Yoshinobu Yamamoto. The complete sequences show how Bauers kept two Brewers rallies alive.
TSP BATTING DATA
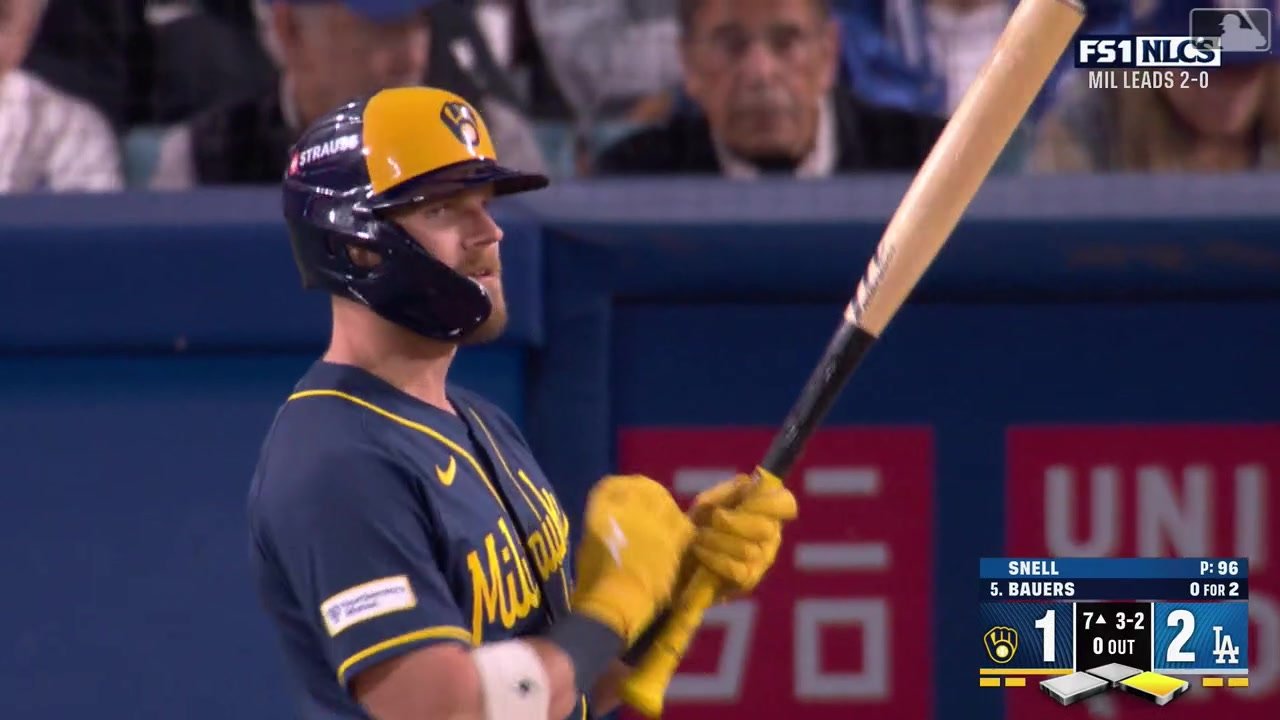
Jake Bauers had already fouled off a slider and a curveball with two strikes when Blake Snell threw him a fastball above the strike zone. Bauers reached the 98.2 mph pitch and fouled it away. He did the same to an 86.3 mph changeup and a 90.9 mph slider. The next fastball arrived at 97.8 mph, much closer to the middle of the plate. Bauers hit it 412 feet into the right-field seats.
His two-run homer on the 11th pitch changed a 2-1 Dodgers lead into a 3-2 Brewers lead in the seventh inning of NLCS Game 3 on October 14. Milwaukee won 6-2 and moved ahead 3-0 in the series. Two nights earlier, Bauers had extended another rally with a 12-pitch walk against Yoshinobu Yamamoto in the Brewers’ 7-4 Game 2 victory.
Across those two plate appearances, Bauers faced 23 physical pitches and swung 13 times without missing. Eleven of those swings produced two-strike foul balls. The other two were the foul tip that gave him his second strike against Snell and the home run that finished the confrontation.
The endings depended on different decisions after the pitcher had two strikes. Bauers kept making contact until Snell put a fastball near the middle, while he left Yamamoto’s final curveball alone.
Five foul balls before Snell’s fastball
Andrew Vaughn opened the seventh with a seven-pitch walk, ending Snell’s run of 14 consecutive batters retired. Christian Yelich replaced Vaughn at first. With nobody out, Bauers came up against the left-hander for the third time. He had flied out in the second inning and struck out on a foul tip in the fourth.
Snell began with a called strike on an 89.4 mph slider. Bauers took a changeup in the dirt and a fastball below the zone before tipping an 87.0 mph changeup into the catcher’s glove. That brought the count to 2-2 after four pitches. The foul tip was strike two; the five later foul balls preserved the plate appearance with two strikes already on the board.
The first pair came against a 90.6 mph slider and an 82.3 mph curveball. Bauers then took a 97.6 mph fastball off the plate to reach a full count. Three more fouls followed, covering a fastball, changeup and slider. Snell had used four pitch types in the confrontation, and Bauers had made contact with each.
Pitch eight, the 98.2 mph fastball, crossed above Bauers’ recorded strike-zone top. Pitch 11 finished near the plate’s horizontal center and within his recorded zone. The difference matters: the earlier swing kept him alive, while the later fastball gave him a more central pitch to hit. Statcast measured the home run at 109.4 mph off the bat with a 34-degree launch angle and a projected distance of 412 feet.
The homer came on Snell’s 99th pitch. Garrett Mitchell followed with another home run, and the Brewers led 4-2 when Snell left. The five two-strike fouls were part of the work that brought Bauers to the decisive pitch, with the previous walk ensuring the swing scored two runs.
Six straight fouls against Yamamoto
Game 2 presented a different problem. Bauers batted with two outs, David Hamilton at second and Brice Turang at first in the third inning. Milwaukee trailed 2-1. A strikeout would have ended the threat with Yamamoto still ahead.
The count reached 3-2 after five pitches, and Bauers had not swung. He had taken two splitters, a fastball, a curveball and another splitter, drawing three balls and two called strikes. The six swings that followed all produced foul balls.
Those pitches covered Yamamoto’s full five-type mix within the plate appearance: a 97.0 mph four-seamer, a 77.7 mph curveball, a 95.7 mph sinker, a 97.4 mph four-seamer, a 93.7 mph cutter and a 92.3 mph splitter. The fastball-to-curveball change between the first two fouls was 19.3 mph. Bauers made contact through that change in speed and continued through the next four deliveries.
Yamamoto finished with a 79.2 mph curveball in the dirt. Bauers took it for ball four, loading the bases. The walk consumed pitches 62 through 73 of Yamamoto’s outing. Two pitches later, Yelich singled home two runs on Yamamoto’s 75th and final delivery, giving Milwaukee a 3-2 lead.
The walk created an opportunity for the next hitter, and Yelich supplied the hit. In Game 3, Bauers supplied that hit himself. The shared element was repeated contact after two strikes, extending each plate appearance until its final pitch changed the inning.
Game 3: the 11-pitch homer
Game 2: the 12-pitch walk
Every pitch from both plate appearances
| Game | Pitch | Count before | Type | MPH | Result | Count after | X (ft) | Height (ft) |
|---|---|---|---|---|---|---|---|---|
| 3 | 1 | 0-0 | Slider | 89.4 | Called Strike | 0-1 | 0.14 | 2.67 |
| 3 | 2 | 0-1 | Changeup | 83.8 | Ball In Dirt | 1-1 | 0.31 | 0.09 |
| 3 | 3 | 1-1 | Four-Seam Fastball | 96.3 | Ball | 2-1 | -0.51 | 1.16 |
| 3 | 4 | 2-1 | Changeup | 87.0 | Foul Tip | 2-2 | 0.63 | 2.20 |
| 3 | 5 | 2-2 | Slider | 90.6 | Foul | 2-2 | -0.06 | 1.98 |
| 3 | 6 | 2-2 | Curveball | 82.3 | Foul | 2-2 | -0.37 | 2.35 |
| 3 | 7 | 2-2 | Four-Seam Fastball | 97.6 | Ball | 3-2 | 1.15 | 2.18 |
| 3 | 8 | 3-2 | Four-Seam Fastball | 98.2 | Foul | 3-2 | 0.48 | 3.82 |
| 3 | 9 | 3-2 | Changeup | 86.3 | Foul | 3-2 | 0.34 | 1.90 |
| 3 | 10 | 3-2 | Slider | 90.9 | Foul | 3-2 | -0.30 | 2.77 |
| 3 | 11 | 3-2 | Four-Seam Fastball | 97.8 | In play, run(s) | 3-2 | 0.08 | 2.63 |
| 2 | 1 | 0-0 | Splitter | 91.8 | Ball | 1-0 | -0.00 | 0.82 |
| 2 | 2 | 1-0 | Splitter | 91.3 | Called Strike | 1-1 | -0.58 | 2.40 |
| 2 | 3 | 1-1 | Four-Seam Fastball | 96.3 | Ball | 2-1 | 0.23 | 3.83 |
| 2 | 4 | 2-1 | Curveball | 76.9 | Called Strike | 2-2 | -0.29 | 2.94 |
| 2 | 5 | 2-2 | Splitter | 91.6 | Ball | 3-2 | -1.14 | 3.22 |
| 2 | 6 | 3-2 | Four-Seam Fastball | 97.0 | Foul | 3-2 | 0.77 | 2.98 |
| 2 | 7 | 3-2 | Curveball | 77.7 | Foul | 3-2 | 0.70 | 1.71 |
| 2 | 8 | 3-2 | Sinker | 95.7 | Foul | 3-2 | 0.11 | 3.01 |
| 2 | 9 | 3-2 | Four-Seam Fastball | 97.4 | Foul | 3-2 | 1.12 | 3.41 |
| 2 | 10 | 3-2 | Cutter | 93.7 | Foul | 3-2 | 1.09 | 2.87 |
| 2 | 11 | 3-2 | Splitter | 92.3 | Foul | 3-2 | -0.80 | 1.33 |
| 2 | 12 | 3-2 | Curveball | 79.2 | Ball In Dirt | 4-2 | 0.86 | 0.55 |
Methods and data
The sample contains the 12-pitch third-inning walk in Game 2 on October 12 and the 11-pitch seventh-inning home run in Game 3 on October 14, 2026. It contains all physical pitches in those two plate appearances, with unique pitch IDs and reconciled pitch order, counts, type and speed from MLB and Baseball Savant. Pickoff attempts, timeouts and an on-field delay are excluded from the physical-pitch total.
Swings with contact include foul balls, foul tips and balls hit into play. The Game 3 foul tip supplied strike two and is counted separately from a foul ball hit with two strikes already recorded. The 11 two-strike fouls are six in Game 2 and five in Game 3. No swing-and-miss percentage or season-long ability estimate is inferred from this selected sample.
Locations and plotted points use the fresh Baseball Savant gamefeeds’ px/pz fields in feet. The CSV also preserves MLB’s separately supplied pX/pZ coordinates, which differ slightly in these records; they are not mixed in a single plot. The rectangle is 17 inches wide with Bauers’ recorded top and bottom. Pitcher pitch totals, game states and home-run measurements come from the official game records. Projected distance is Statcast’s estimate.