

MLB
Ohtani’s Postseason Problem: Late Contact, Lost Power and an Unsettled Health Question
Shohei Ohtani has documented biceps and knee injuries. His postseason video and pitch data reveal a timing problem, but cannot determine how much of it is physical.
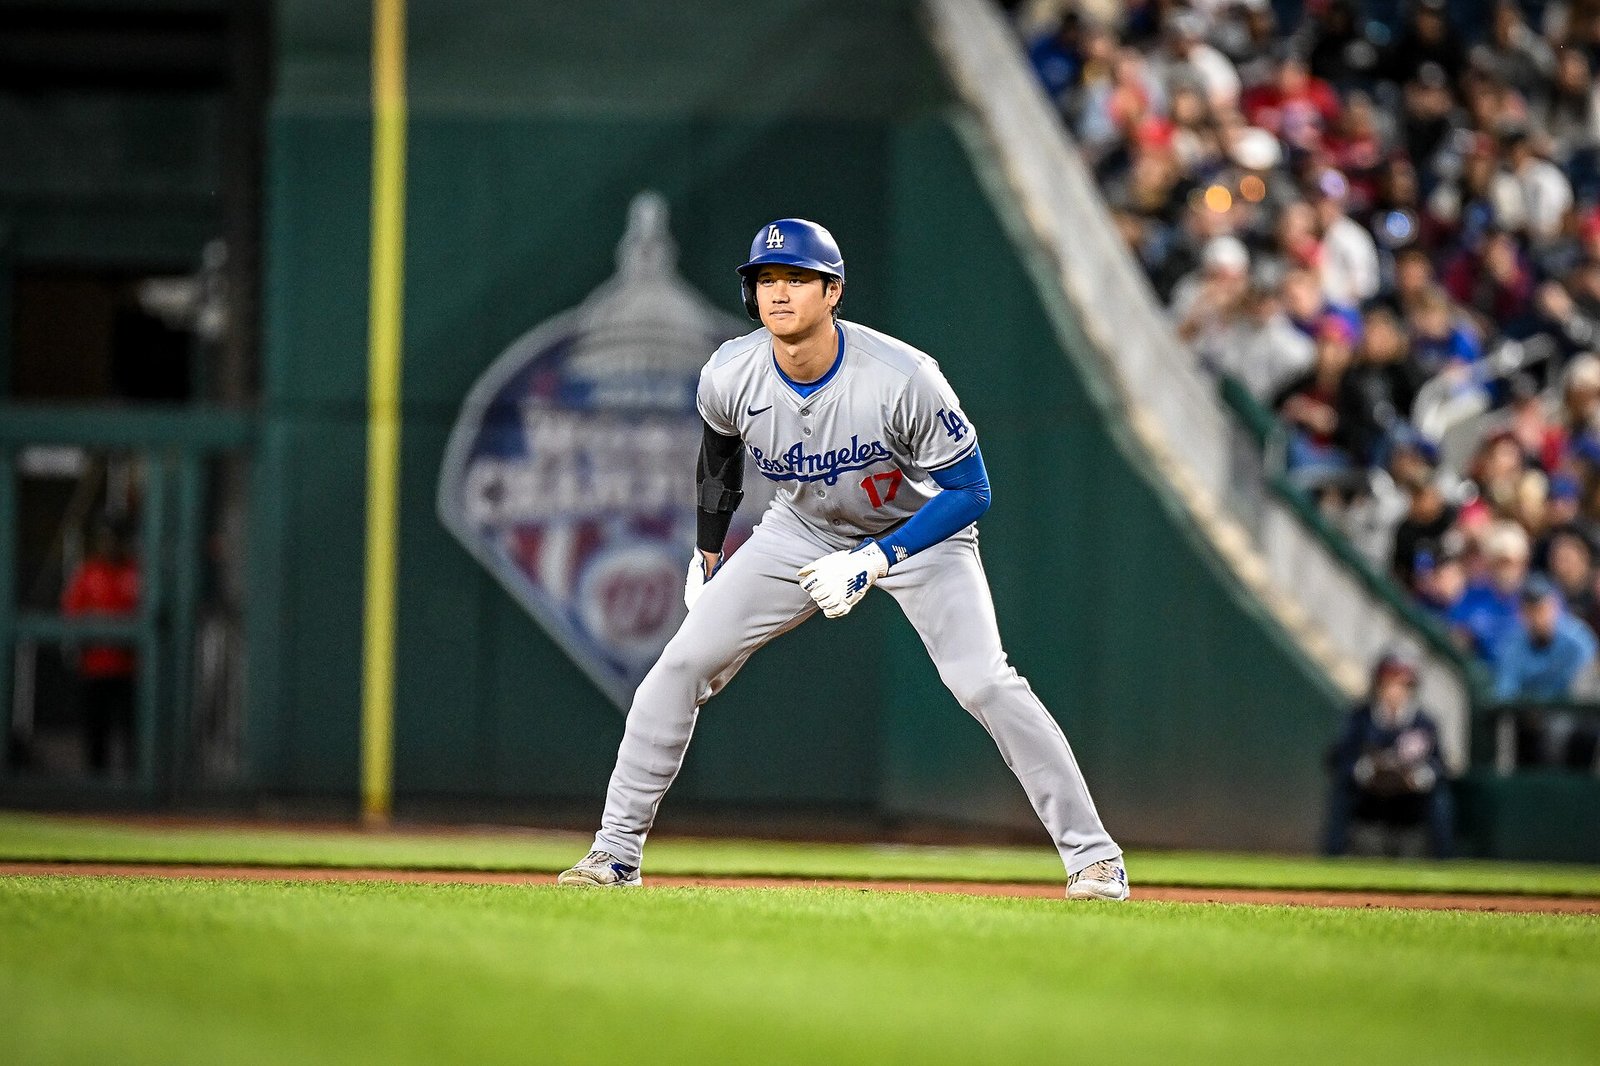
Shohei Ohtani’s postseason slump has a visible shape: fastballs reaching him before he can drive them, very little extra-base production and a lineup decision that would have seemed unlikely when the season began. It also has documented health context. The Dodgers’ designated hitter has been managing right-biceps and left-knee problems, both of which preceded his September stay on the injured list.
The difficult question is how those problems connect. Public reporting establishes that Ohtani has been hurt. It does not establish how much current pain, interrupted preparation or altered timing is responsible for each unsuccessful swing. The clearest measurable change is his difficulty turning velocity into productive contact.
Through NLCS Game 2 on October 12, Ohtani was 3-for-20 in six postseason games, with all three hits singles. He had struck out seven times. With Los Angeles down 0-2 to Milwaukee, reports that the Dodgers would discuss sitting him for Game 3 moved the issue beyond batting-order adjustments. A discussion about his availability, however, is not a confirmed benching.
The health problems are already documented
MLB.com has reported that the biceps and knee issues date to at least June. By September, the Dodgers had stopped his two-way work and placed him on the injured list, backdated to September 8. Their rehabilitation updates described a gradual hitting progression that began with tee work. He returned September 23 with only five regular-season games remaining.
That left a short runway for recovering game timing. It also leaves several possible explanations operating together: a hitter can be physically limited, short of repetitions against live pitching and facing opponents who recognize a weakness. Results alone cannot assign a percentage to each one.
After Game 2, Dave Roberts told The Athletic that he needed to speak with Ohtani about what would be best for the player and the club, according to MLB.com’s account. ESPN’s reporting said the plan was to continue playing him if he deemed himself healthy enough. Those reports support taking his condition seriously; they do not identify a newly diagnosed injury.
The decline against velocity
A split at August 18, the date of Ohtani’s last home run through Game 2, captures the extent of the change. Through that date, he hit .294 and slugged .558. From August 19 through October 12, combining the regular season and playoffs, he went 14-for-90 with two doubles, one triple and no home runs. His slugging percentage in that later stretch was .200.
The difference is especially sharp in at-bats that ended on pitches of at least 95 mph. Before the dividing point, Ohtani had 26 hits in 93 such at-bats. After it, he had one in 28, a double. That is a fall from a .280 average to .036 within the velocity band.
| Period | Hits / AB | AVG | SLG |
|---|---|---|---|
| Through August 18 | 26/93 | .280 | .441 |
| August 19–October 12 | 1/28 | .036 | .071 |
This is a terminal-pitch split: it classifies an at-bat by the pitch that ended it. It does not count every plate appearance in which he saw a hard fastball. The later sample is also only 28 at-bats. Still, the contrast is large enough to make handling velocity a central part of the explanation, particularly when the video shows contact occurring farther back.
It is not evidence that every fastball beats him. His lone hit in the later group was a September 24 double against Mason Miller. Including that exception matters because the question is whether Ohtani can produce quality swings often enough, rather than whether he remains capable of one.
What the comparison video shows
In Mike Petriello’s Statcast analysis for MLB.com, a comparison pairs two sinkers from Milwaukee left-handers. Shane Drohan’s August 13 pitch was 95.2 mph; JoJo Romero’s in NLCS Game 2 was 94.1. Both were on the inner half. Ohtani drove the first for a double and fouled off the second.
TSP’s review of the pitch records adds useful qualifications. The August pitch arrived on a 3-1 count, compared with 1-0 in October. The October sinker was approximately four inches lower. Pitch movement and the preceding sequence also matter, so the clips are a comparison of outcomes against broadly similar pitches, not a controlled experiment.
The tracking nevertheless records a striking difference in where his bat met the ball: about 26.4 inches in front of his body on the double, compared with 6.5 inches on the foul. The October contact occurred much deeper. That observation is consistent with lateness; it cannot reveal whether pain, anticipation or another factor caused it.
The wider postseason sample points in the same direction. Across 52 swings with the relevant tracking values, Ohtani’s average intercept point was approximately 21.7 inches in front of his body. His recorded average through August 18 was about 25.6 inches. Intercept point describes the bat-ball meeting point, or nearest approach on a miss, so this is not simply an average of his three hits.
His recorded attack angle also fell, from approximately 12.5 degrees in the earlier sample to 7.8 in the postseason. Attack angle measures the bat’s vertical path at that point; launch angle measures the ball leaving the bat. A flatter measured path alongside deeper contact is a description of the swings, not proof that he consciously rebuilt his mechanics or cannot use his legs.
The evidence that complicates an injury-only explanation
Ohtani’s first five games after returning from the injured list produced a different contact profile from his October games. Nine of his 12 batted balls with recorded exit velocity were hit at least 95 mph, and four were barrels, Statcast’s combination of exit speed and launch angle associated with strong offensive results. He still went only 5-for-21 with eight strikeouts.
| Sample | Hits / AB | Hard-hit balls | Barrels |
|---|---|---|---|
| September 23–27 | 5/21 | 9/12 (75.0%) | 4 |
| Postseason through October 12 | 3/20 | 5/13 (38.5%) | 0 |
One of his 13 regular-season batted balls in that first group lacks exit-velocity tracking. The denominators are small in both groups, and the opponents differ. Even so, the strong contact immediately after his return prevents a simple claim that his ability to hit the ball hard disappeared and never came back.
There has been some hard contact in October, too: five of his 13 batted balls reached the threshold. The more precise concern is the scarcity of damage. None was a barrel, and none of his hits went for extra bases. A hitter can retain the capacity for a forceful swing while struggling to place it on the right pitch at the right time.
Why the next adjustment is difficult
Ohtani also swung at 22 of the 64 postseason pitches coded outside the strike zone, a chase rate of 34.4 percent. That offers pitchers another way to finish an at-bat after getting ahead or disrupting his timing. It is a six-game observation, not evidence of a continuous two-month increase in chasing.
The sequence against Romero illustrates the problem. The sinker produced the deep-contact foul; the plate appearance later ended with a strikeout on a low-and-away sweeper. Preparing earlier for velocity can make speed changes and pitches leaving the zone harder to resist. That is the tactical dilemma visible in the matchup, even without knowing exactly how Ohtani feels.
For the Dodgers, the decision about Game 3 must incorporate information the public statistics cannot supply: his current symptoms and the medical staff’s assessment. On the field, the useful signs of improvement would be repeatable contact against velocity and damage on pitches he can drive. One hard-hit ball would show capability. A sustained run of those swings would offer stronger evidence that his timing is returning.
Sources, video and data methods
Performance data stop after October 12, 2026; this analysis does not announce a Game 3 lineup decision. TSP calculated splits from official MLB game logs and Baseball Savant records. Administrative truncated-plate-appearance records are excluded from at-bat totals. Hard-hit means at least 95 mph off the bat among tracked batted balls. Recorded swing averages use available swing rows and are not official competitive-swing bat-speed leaderboard figures. Definitions: attack angle and intercept point. Related TSP reporting: the Game 3 discussion and Romero’s Game 2 pitch study.
Cover photograph: Shohei Ohtani in Washington in April 2024, by Joe Glorioso / All-Pro Reels, via Wikimedia Commons, CC BY-SA 2.0. Resized under the same license; no added text. This archival photograph does not depict the current injury.
.jpg)