
Business of Sports · MLB · RATINGS
MLB Playoff TV Ratings: What the Early NLCS–ALCS Gap Shows
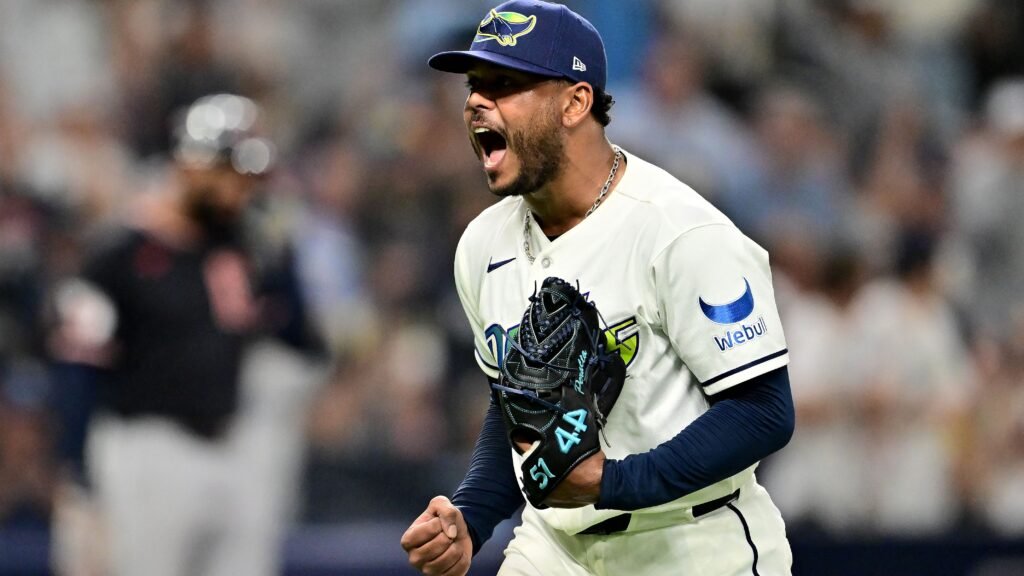
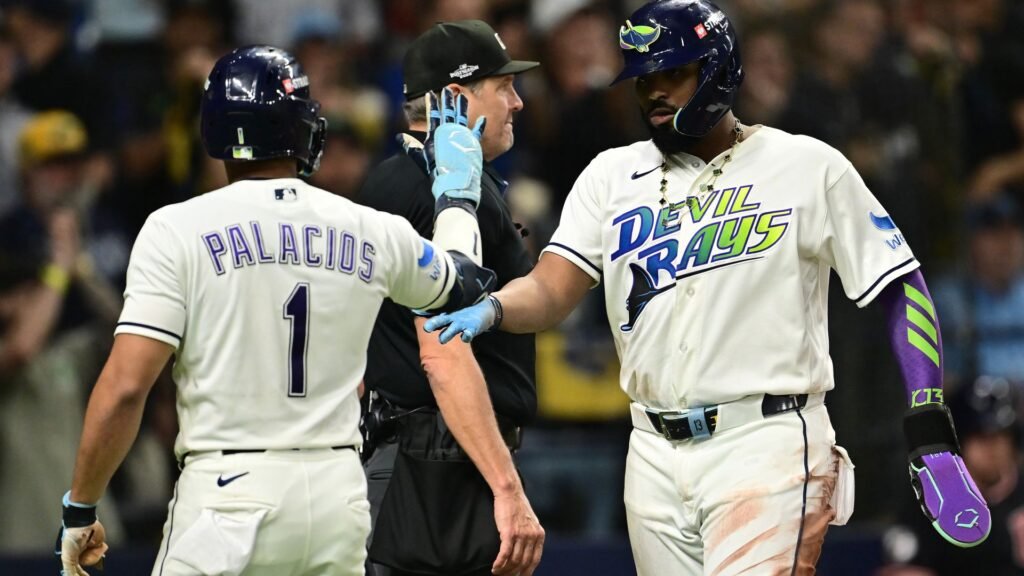
The NLCS averaged 7.98 million viewers through three games, compared with 4.0 million for the ALCS through two. Different samples and television windows shape what that gap establishes.
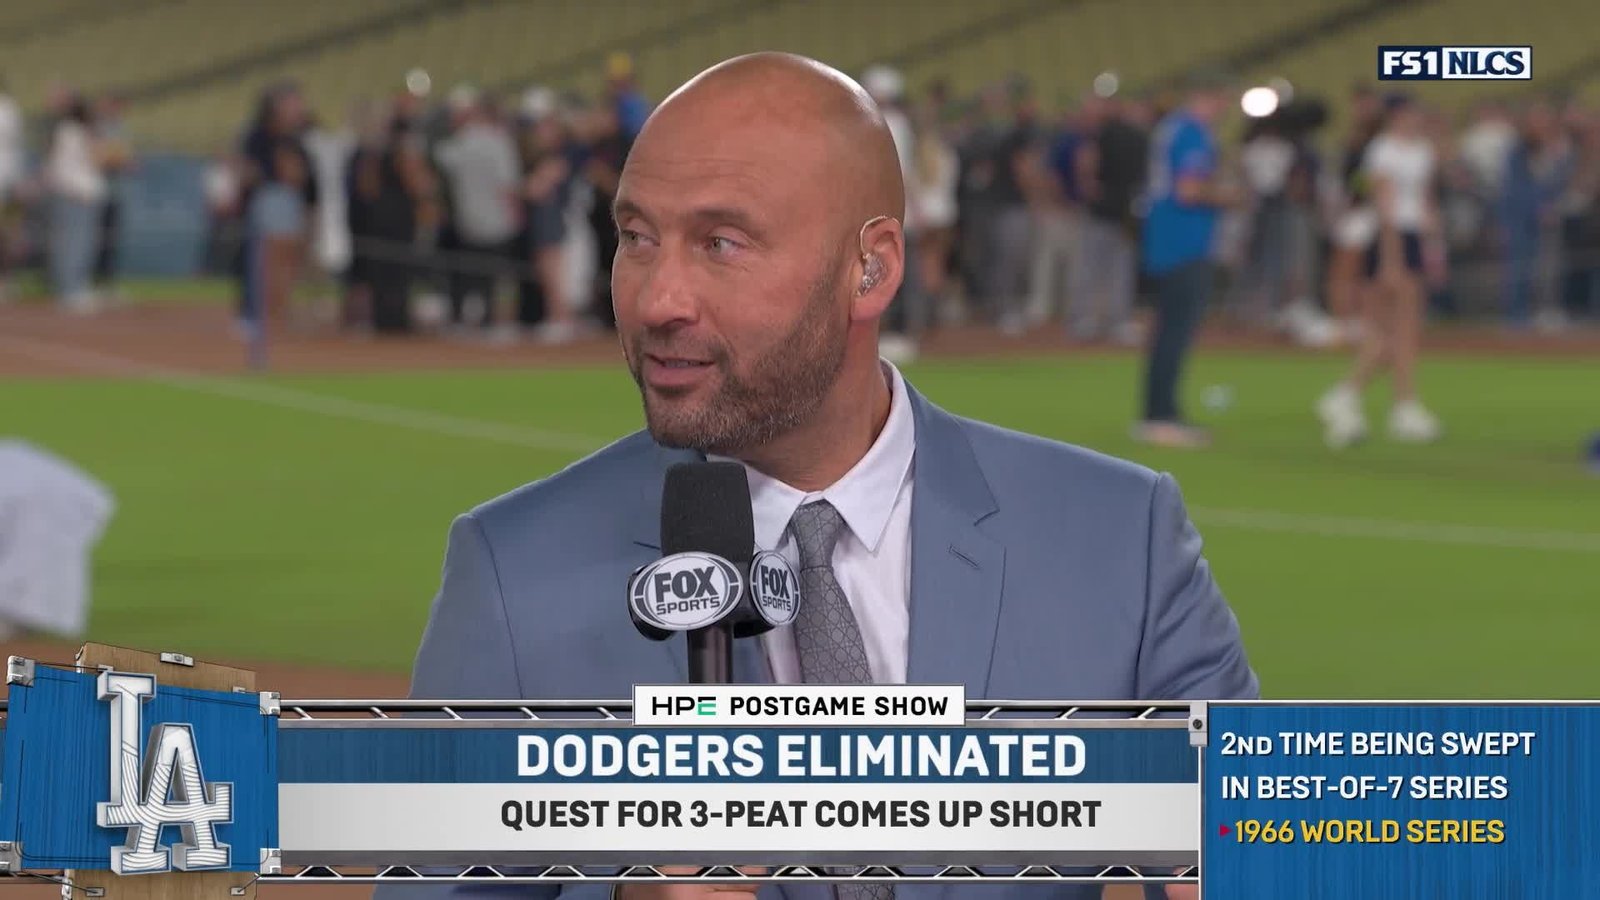
The Brewers–Dodgers National League Championship Series drew nearly twice the average television audience of Guardians–Rays in the American League in the early figures reported October 16. The comparison captures a substantial difference between the opening games, with important limits on what it says about demand for the two matchups.
Sports Media Watch reported a 7.98 million average for the NLCS through three games on FOX and FS1, compared with 4.0 million for the ALCS through two on TNT Sports. Those are partial-series measurements with different game counts and distribution. They are not final series averages.
| Series | Games covered | Reported distribution | Average viewers |
|---|---|---|---|
| Brewers–Dodgers NLCS | First three | FOX/FS1, English-language coverage | 7.98 million |
| Guardians–Rays ALCS | First two | TNT Sports | 4.0 million |
The difference is 3.98 million viewers, calculated from the reported averages. It should not be described as 3.98 million additional individual fans. An average audience is a measurement of viewing during the broadcasts; it does not identify how many different people watched across multiple games.
Different television windows
The opening games reached viewers in different circumstances. The NLCS opener followed NFL coverage on FOX. The ALCS opener competed with Monday Night Football, according to Sports Media Watch’s report on the early championship-series audiences.
That matters when assessing the gap. The reported result includes the matchups, their distribution and their television windows together. It cannot separate how much of the difference came from the teams themselves, the competing programming or the opportunity to carry viewers from an earlier broadcast.
FOX and FS1 also represent different distribution within the same NLCS package. A package spanning broadcast and cable should be identified that way, rather than described as if every game appeared in an identical setting.
What the early averages establish
The figures establish that the NLCS had the larger reported average in these samples. They do not establish that every NLCS game outdrew every ALCS game, or that the relationship remained the same through the end of either series.
The unequal number of games is another limit. Adding a fourth NLCS game or a third ALCS game could move either average. Comparing two completed series would answer a different question from comparing these opening samples.
The English-language scope matters, too. The NLCS package figure should not be silently combined with individual-game totals that include Fox Deportes. A larger combined-network number and an English-language average can both be accurate while measuring different coverage.
For a later comparison, the useful additions are fuller series averages and game-level figures with their networks, windows and coverage scope preserved. Those would show whether the early difference persisted and how it varied from game to game. The October 16 numbers supply a clear starting point for that comparison, rather than a final verdict on the two series.
Explore the Ratings database for the underlying reported audience records and their measurement periods.
Sources and notes
- Audience figures and television windows: Sports Media Watch, October 16, 2026. NLCS first three games on English-language FOX/FS1; ALCS first two games on TNT Sports. https://www.sportsmediawatch.com/2026/10/nlcs-viewership-highs-brewers-dodgers-alcs-guardians-rays-mlb-postseason/