
MLB · Pitching Data
Rasmussen’s seven strikeouts came with hard contact and two first-pitch home runs
All 91 pitches from Drew Rasmussen’s ALCS opener, with a reconciled regular-season comparison. Cleveland’s contact and two first-pitch homers explain how five scoreless innings became a tie.
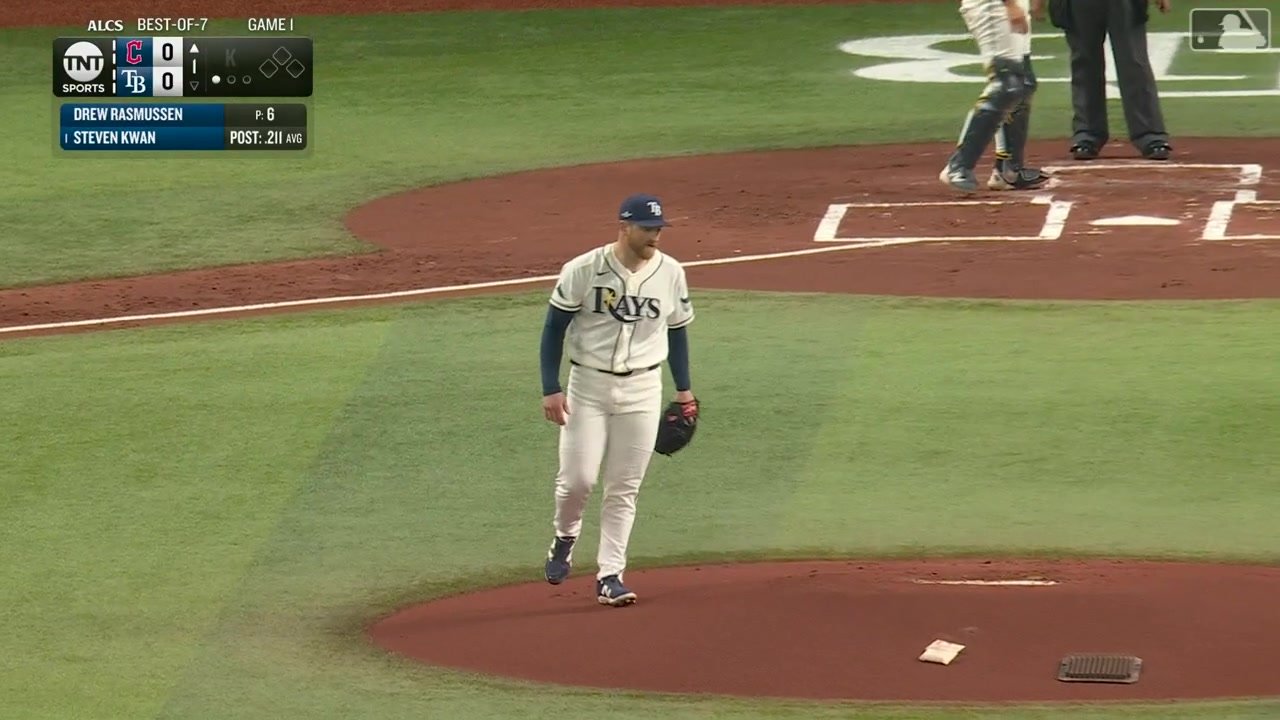
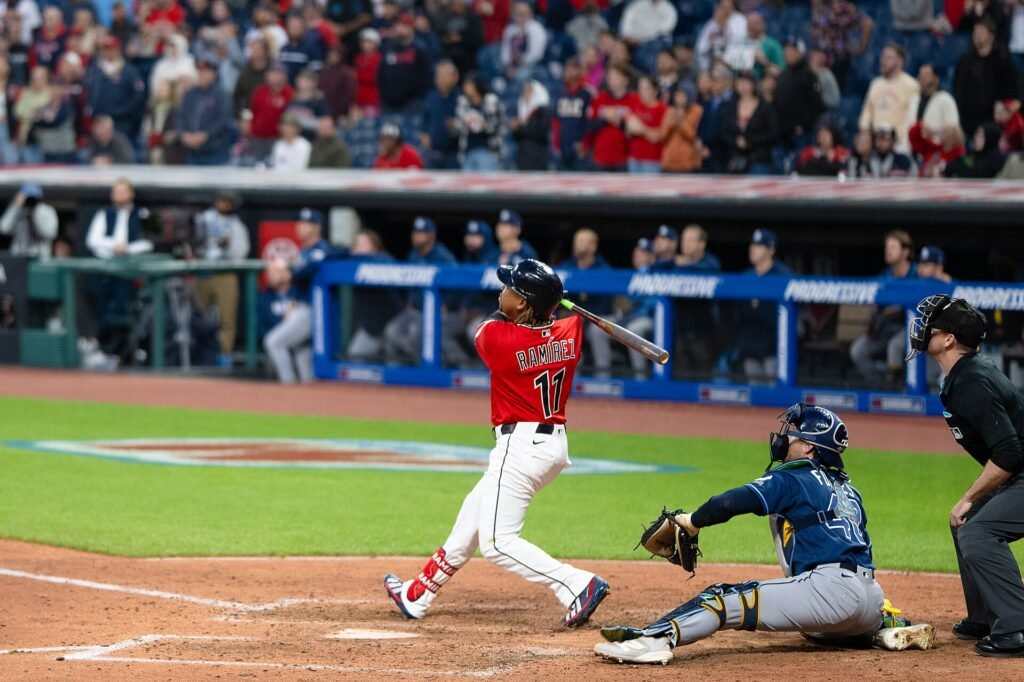
Drew Rasmussen had kept Cleveland scoreless through five innings when Chase DeLauter opened the sixth by hitting his first pitch for a home run. Patrick Bailey did the same to begin the seventh. One was a four-seam fastball and the other a cutter. Together they turned Tampa Bay’s 2–0 lead into a 2–2 tie and ended Rasmussen’s night.
Rasmussen finished with six innings, eight hits, two earned runs and seven strikeouts, without a walk. His 91st and final pitch was Bailey’s game-tying homer, so the six-inning line includes a batter faced in the seventh without an out recorded in that inning.
The strikeout total captures an important part of the outing. The complete pitch record adds another: Cleveland missed only seven times on 52 swing attempts and produced nine hard-hit balls among 18 measured balls in play. Those opportunities help explain how the Guardians kept threatening before the two home runs finally changed the score.
How the pitch mix changed
Rasmussen used 30 cutters, 25 four-seam fastballs, 22 sinkers, 12 changeups and two curveballs. The cutter led at 33.0% of the outing, up from 28.8% in the comparison. Four-seam and sinker shares remained close to their comparison levels. No sweeper was recorded in Game 1.
The comparison contains 2,596 pitches from 29 fully reconciled Tampa Bay regular-season starts between March 26 and September 22. His April 18 start is excluded in full because the public event feed contains 63 physical pitches against an official total of 64. No missing pitch or measurement has been estimated.
Cleveland’s left-handed hitters accounted for 76 of the 91 pitches, a larger share than in the comparison. That matters when interpreting the overall mix. Rasmussen used 25 cutters in those 76 pitches, against 422 in 1,566 comparison pitches to left-handed hitters. The increase is visible within that hitter group, although one game cannot establish a lasting change.
Game 1 against the regular-season sample
Shares use all recorded pitches. Blue is Game 1, gray is the declared same-club starter comparison.
Cutter
Four-Seam Fastball
Sinker
Changeup
Curveball
Sweeper
| Pitch | Game 1 count | Game 1 mph | Sample mph | Misses / swings | Game 1 miss rate | Sample miss rate |
|---|---|---|---|---|---|---|
| Cutter | 30 | 89.5 | 89.9 | 2/20 | 10.0% | 25.6% |
| Four-Seam Fastball | 25 | 95.6 | 95.8 | 4/16 | 25.0% | 26.3% |
| Sinker | 22 | 94.8 | 95.3 | 0/7 | 0.0% | 17.6% |
| Changeup | 12 | 89.0 | 89.6 | 1/9 | 11.1% | 35.0% |
| Curveball | 2 | 82.2 | 80.1 | 0/0 | No swings | 25.0% |
| Sweeper | 0 | Not recorded | 84.4 | 0/0 | No swings | 17.1% |
What the strikes and contact show
The cutter averaged 89.5 mph, compared with 89.9 in the reconciled sample. It drew 20 swing attempts and two misses, a 10.0% miss rate against 25.6% in the comparison. Cleveland put seven cutters in play, four at 95 mph or harder. Bailey’s homer was the last of those contacts.
The four-seam averaged 95.6 mph, against 95.8 in the comparison, and produced four misses from 16 swings. Its six called strikes brought the pitch’s called-strike-plus-whiff rate to 40.0%. The sinker drew no misses on seven swings but supplied eight called strikes. Those takes were a substantial part of Rasmussen’s ability to acquire strikes.
Overall, his seven misses from 52 swings produced a 13.5% rate, compared with 25.2% in the regular-season sample. Sixteen called strikes raised his called-strike-plus-whiff rate to 25.3% of all pitches. Seven completed strikeouts can coexist with that lower miss rate because strikeouts also depend on count progression and called strikes.
DeLauter’s home run came on outing pitch 81, a 94.1 mph four-seam at a measured plate location of −0.464 feet horizontally and 2.956 feet vertically. His contact was measured at 102.3 mph with a 26-degree launch angle and a 381-foot tracked distance. Bailey’s homer came on pitch 91, a 90.4 mph cutter at 0.214 feet horizontally and 2.732 feet vertically. It left at 105.3 mph, also at 26 degrees, with a 436-foot tracked distance.
Both pitches were inside each hitter’s recorded ball-center strike-zone rectangle. Their locations show where the ball crossed the plate, without establishing the intended target or proving a mechanical mistake. The different pitch types also make it inaccurate to describe the two homers as punishment of the same offering.
Seven pitches to strike out Steven Kwan
Workload and the final line
Rasmussen spent 21, 15, 19, 13 and 12 pitches on the first five innings. The sixth cost ten, followed by Bailey’s single pitch in the seventh. The seven strikeouts helped him get through threats, including consecutive strikeouts of Bailey and Petey Halpin in the fourth after Travis Bazzana singled and stole second.
Cleveland’s nine hard-hit balls represented half of its 18 measured balls in play against Rasmussen, compared with 152 of 446, or 34.1%, in the comparison. All of the outing’s balls in play have an exit-speed measurement. That stronger contact profile is a more complete account of the pressure than either the scoreless opening five innings or the strikeout total alone.
Cam Booser replaced Rasmussen after Bailey’s homer. The Rays bullpen later conceded five more runs as Cleveland won 7–3. Those runs belong to the subsequent pitching sequence. Rasmussen’s own analysis ends with the tying homer and a six-inning line that combined strike acquisition with repeated contact.
Release speed through the outing
| Inning | Pitches | Called strikes | Misses | Swings | Miss rate |
|---|---|---|---|---|---|
| 1 | 21 | 4 | 1 | 12 | 8.3% |
| 2 | 15 | 2 | 1 | 9 | 11.1% |
| 3 | 19 | 3 | 0 | 11 | 0.0% |
| 4 | 13 | 3 | 2 | 7 | 28.6% |
| 5 | 12 | 3 | 2 | 5 | 40.0% |
| 6 | 10 | 1 | 1 | 7 | 14.3% |
| 7 | 1 | 0 | 0 | 1 | 0.0% |
Every pitch
Filter the complete outing or select a pitch number to inspect its recorded measurements. The at-bat outcome column describes the completed plate appearance.
91 of 91 pitches
No pitches match these filters.
Download the 2596 comparison pitches as CSV
| Pitch | Inn. | Batter | Before | Type | mph | Pitch outcome | At-bat outcome | Spin rpm | Extension ft | IVB in | HB in | Plate x ft | Plate z ft | Exit mph |
|---|---|---|---|---|---|---|---|---|---|---|---|---|---|---|
| 1 | Steven Kwan | 0–0 | Sinker | 93.3 | Called Strike | Strikeout | 2090 | 6.60 | 8.9 | 17.4 | -0.346 | 2.129 | Not recorded | |
| 1 | Steven Kwan | 0–1 | Four-Seam Fastball | 95.4 | Called Strike | Strikeout | 2313 | 6.51 | 18.2 | 8.0 | -0.716 | 2.599 | Not recorded | |
| 1 | Steven Kwan | 0–2 | Changeup | 88.5 | Foul | Strikeout | 957 | 6.51 | 1.3 | 12.7 | -0.639 | 2.456 | Not recorded | |
| 1 | Steven Kwan | 0–2 | Cutter | 89.9 | Ball | Strikeout | 2615 | 6.46 | 6.8 | -4.2 | 1.581 | 0.941 | Not recorded | |
| 1 | Steven Kwan | 1–2 | Sinker | 94.6 | Foul | Strikeout | 2294 | 6.48 | 14.3 | 17.4 | 0.354 | 2.099 | Not recorded | |
| 1 | Steven Kwan | 1–2 | Four-Seam Fastball | 96.1 | Foul | Strikeout | 2371 | 6.78 | 20.9 | 5.2 | -0.157 | 2.559 | Not recorded | |
| 1 | Steven Kwan | 1–2 | Cutter | 89.4 | Swinging Strike | Strikeout | 2519 | 6.49 | 4.3 | -2.8 | -0.599 | 3.010 | Not recorded | |
| 1 | José Ramírez | 0–0 | Four-Seam Fastball | 94.5 | Called Strike | Single | 2247 | 6.31 | 19.8 | 4.2 | -0.616 | 2.718 | Not recorded | |
| 1 | José Ramírez | 0–1 | Sinker | 94.3 | Ball | Single | 2277 | 6.51 | 10.6 | 17.8 | 1.135 | 1.917 | Not recorded | |
| 1 | José Ramírez | 1–1 | Changeup | 88.6 | Ball | Single | 826 | 6.37 | 4.6 | 5.9 | -0.811 | 3.460 | Not recorded | |
| 1 | José Ramírez | 2–1 | Cutter | 89.8 | Foul | Single | 2604 | 6.34 | 3.8 | -5.9 | 0.407 | 2.390 | Not recorded | |
| 1 | José Ramírez | 2–2 | Four-Seam Fastball | 96.9 | Foul | Single | 2408 | 6.65 | 19.6 | 3.7 | 0.130 | 2.513 | Not recorded | |
| 1 | José Ramírez | 2–2 | Cutter | 85.7 | Foul | Single | 2537 | 6.46 | -2.5 | -4.1 | 0.674 | 1.081 | Not recorded | |
| 1 | José Ramírez | 2–2 | Sinker | 94.4 | Foul | Single | 2240 | 6.47 | 11.6 | 17.0 | -0.491 | 2.985 | Not recorded | |
| 1 | José Ramírez | 2–2 | Changeup | 89.3 | In play, no out | Single | 839 | 6.55 | 0.7 | 7.3 | -0.340 | 1.585 | 87.4 | |
| 1 | Chase DeLauter | 0–0 | Four-Seam Fastball | 94.7 | Called Strike | Single | 2317 | 6.65 | 20.4 | 5.3 | -0.184 | 2.078 | Not recorded | |
| 1 | Chase DeLauter | 0–1 | Cutter | 90.5 | Ball | Single | 2658 | 6.56 | 7.4 | -7.1 | 1.640 | 2.579 | Not recorded | |
| 1 | Chase DeLauter | 1–1 | Sinker | 94.6 | In play, no out | Single | 2336 | 6.39 | 8.3 | 18.1 | -0.399 | 1.823 | 90.8 | |
| 1 | Jo Adell | 0–0 | Cutter | 86.8 | Foul | Groundout | 2505 | 6.38 | -2.3 | -5.8 | 0.163 | 2.118 | Not recorded | |
| 1 | Jo Adell | 0–1 | Sinker | 94.4 | Ball | Groundout | 2459 | 6.52 | 14.2 | 17.2 | 0.296 | 1.522 | Not recorded | |
| 1 | Jo Adell | 1–1 | Sinker | 95.1 | In play, out(s) | Groundout | 2434 | 6.48 | 11.6 | 19.0 | -0.046 | 2.511 | 62.6 | |
| 2 | Nathaniel Lowe | 0–0 | Four-Seam Fastball | 94.2 | Called Strike | Single | 2360 | 6.56 | 21.7 | 1.9 | 0.344 | 2.112 | Not recorded | |
| 2 | Nathaniel Lowe | 0–1 | Cutter | 91.6 | Ball | Single | 2565 | 6.42 | 5.4 | -1.0 | 1.383 | 1.485 | Not recorded | |
| 2 | Nathaniel Lowe | 1–1 | Sinker | 95.4 | Ball | Single | 2376 | 6.57 | 13.1 | 17.3 | 0.634 | 1.516 | Not recorded | |
| 2 | Nathaniel Lowe | 2–1 | Four-Seam Fastball | 96.0 | In play, no out | Single | 2361 | 6.49 | 19.6 | 3.5 | 0.625 | 1.950 | 112.2 | |
| 2 | Travis Bazzana | 0–0 | Sinker | 93.4 | Called Strike | Flyout | 2180 | 6.41 | 10.3 | 18.6 | -0.513 | 3.276 | Not recorded | |
| 2 | Travis Bazzana | 0–1 | Sinker | 94.2 | In play, out(s) | Flyout | 2310 | 6.48 | 9.4 | 18.5 | 0.182 | 2.299 | 93.4 | |
| 2 | Patrick Bailey | 0–0 | Changeup | 87.9 | Foul | Single | 848 | 6.49 | 10.8 | 2.3 | 0.596 | 2.064 | Not recorded | |
| 2 | Patrick Bailey | 0–1 | Cutter | 90.3 | Ball | Single | 2622 | 6.52 | 6.5 | -0.8 | 0.594 | 1.489 | Not recorded | |
| 2 | Patrick Bailey | 1–1 | Sinker | 95.2 | Ball | Single | 2277 | 6.55 | 14.0 | 17.0 | -0.437 | 1.187 | Not recorded | |
| 2 | Patrick Bailey | 2–1 | Cutter | 89.4 | Foul | Single | 2576 | 6.48 | 4.0 | -3.8 | 0.521 | 2.237 | Not recorded | |
| 2 | Patrick Bailey | 2–2 | Changeup | 89.0 | In play, no out | Single | 973 | 6.37 | 1.8 | 11.9 | -0.340 | 2.982 | 100.5 | |
| 2 | Petey Halpin | 0–0 | Four-Seam Fastball | 95.0 | In play, out(s) | Lineout | 2316 | 6.74 | 18.6 | 5.9 | -0.187 | 2.122 | 93.8 | |
| 2 | Brayan Rocchio | 0–0 | Cutter | 89.4 | Foul | Strikeout | 2646 | 6.51 | 4.1 | -7.2 | 0.897 | 1.899 | Not recorded | |
| 2 | Brayan Rocchio | 0–1 | Changeup | 88.2 | Foul | Strikeout | 1163 | 6.37 | 2.8 | 8.6 | -0.352 | 2.590 | Not recorded | |
| 2 | Brayan Rocchio | 0–2 | Four-Seam Fastball | 96.5 | Swinging Strike | Strikeout | 2644 | 6.64 | 21.8 | 3.7 | 0.217 | 3.944 | Not recorded | |
| 3 | Steven Kwan | 0–0 | Cutter | 91.6 | Ball | Single | 2608 | 6.60 | 8.3 | -4.7 | 1.414 | 1.551 | Not recorded | |
| 3 | Steven Kwan | 1–0 | Sinker | 94.4 | Called Strike | Single | 2325 | 6.49 | 12.4 | 18.2 | 0.125 | 3.170 | Not recorded | |
| 3 | Steven Kwan | 1–1 | Cutter | 91.5 | Foul | Single | 2683 | 6.69 | 9.4 | -6.0 | 0.746 | 2.579 | Not recorded | |
| 3 | Steven Kwan | 1–2 | Four-Seam Fastball | 96.3 | Foul | Single | 2370 | 6.65 | 18.7 | 4.7 | -0.564 | 3.606 | Not recorded | |
| 3 | Steven Kwan | 1–2 | Changeup | 89.0 | Ball | Single | 1087 | 6.09 | 3.8 | 13.3 | -1.702 | 3.354 | Not recorded | |
| 3 | Steven Kwan | 2–2 | Cutter | 91.1 | Foul | Single | 2710 | 6.56 | 3.5 | -6.8 | 0.961 | 1.504 | Not recorded | |
| 3 | Steven Kwan | 2–2 | Four-Seam Fastball | 96.9 | In play, no out | Single | 2396 | 6.58 | 18.8 | 2.0 | -0.268 | 2.621 | 80.3 | |
| 3 | José Ramírez | 0–0 | Changeup | 89.4 | Ball | Flyout | 1004 | 6.31 | 13.2 | 5.9 | 0.732 | 2.816 | Not recorded | |
| 3 | José Ramírez | 1–0 | Cutter | 91.2 | In play, out(s) | Flyout | 2570 | 6.39 | 6.1 | -3.8 | 0.192 | 2.212 | 80.2 | |
| 3 | Chase DeLauter | 0–0 | Sinker | 95.6 | Called Strike | Groundout | 2256 | 6.40 | 11.2 | 16.7 | 0.185 | 3.359 | Not recorded | |
| 3 | Chase DeLauter | 0–1 | Changeup | 89.7 | Foul | Groundout | 1148 | 6.45 | 7.3 | 6.7 | 0.118 | 1.849 | Not recorded | |
| 3 | Chase DeLauter | 0–2 | Cutter | 88.3 | In play, out(s) | Groundout | 2638 | 6.50 | 0.0 | -4.2 | 0.449 | 2.563 | 98.6 | |
| 3 | Jo Adell | 0–0 | Four-Seam Fastball | 96.1 | Ball | Groundout | 2352 | 6.67 | 16.8 | 1.6 | 1.357 | 2.726 | Not recorded | |
| 3 | Jo Adell | 1–0 | Cutter | 89.7 | Foul | Groundout | 2555 | 6.51 | 3.2 | -6.6 | 0.798 | 2.516 | Not recorded | |
| 3 | Jo Adell | 1–1 | Sinker | 94.7 | Called Strike | Groundout | 2434 | 6.52 | 13.9 | 15.5 | 0.315 | 1.809 | Not recorded | |
| 3 | Jo Adell | 1–2 | Four-Seam Fastball | 97.0 | Foul | Groundout | 2509 | 6.65 | 20.9 | 4.7 | 0.733 | 2.382 | Not recorded | |
| 3 | Jo Adell | 1–2 | Cutter | 88.2 | Ball In Dirt | Groundout | 2614 | 6.53 | -2.2 | -1.4 | 1.212 | 0.480 | Not recorded | |
| 3 | Jo Adell | 2–2 | Changeup | 89.1 | Foul | Groundout | 1227 | 6.38 | 3.7 | 9.4 | -0.073 | 1.669 | Not recorded | |
| 3 | Jo Adell | 2–2 | Sinker | 97.0 | In play, out(s) | Groundout | 2535 | 6.46 | 13.3 | 15.4 | 0.315 | 2.006 | 105.4 | |
| 4 | Nathaniel Lowe | 0–0 | Cutter | 91.0 | Ball | Groundout | 2563 | 6.42 | 9.4 | -5.4 | 0.316 | 0.490 | Not recorded | |
| 4 | Nathaniel Lowe | 1–0 | Cutter | 89.0 | Foul | Groundout | 2634 | 6.25 | 4.0 | -3.4 | 0.185 | 2.880 | Not recorded | |
| 4 | Nathaniel Lowe | 1–1 | Sinker | 95.5 | Ball | Groundout | 2435 | 6.44 | 15.1 | 14.6 | 0.244 | 3.559 | Not recorded | |
| 4 | Nathaniel Lowe | 2–1 | Cutter | 91.2 | In play, out(s) | Groundout | 2607 | 6.30 | 8.6 | -4.7 | 0.497 | 2.077 | 105.8 | |
| 4 | Travis Bazzana | 0–0 | Cutter | 90.7 | Called Strike | Single | 2583 | 6.56 | 5.4 | -1.0 | 0.401 | 2.246 | Not recorded | |
| 4 | Travis Bazzana | 0–1 | Changeup | 89.3 | In play, no out | Single | 1179 | 6.31 | 3.5 | 2.2 | -0.253 | 2.755 | 105.4 | |
| 4 | Patrick Bailey | 0–0 | Four-Seam Fastball | 95.2 | Foul | Strikeout | 2395 | 6.78 | 16.7 | 6.0 | -0.267 | 2.744 | Not recorded | |
| 4 | Patrick Bailey | 0–1 | Sinker | 95.4 | Called Strike | Strikeout | 2308 | 6.53 | 13.4 | 16.1 | 0.306 | 3.218 | Not recorded | |
| 4 | Patrick Bailey | 0–2 | Four-Seam Fastball | 96.1 | Swinging Strike | Strikeout | 2465 | 6.45 | 21.0 | 6.0 | -0.161 | 3.645 | Not recorded | |
| 4 | Petey Halpin | 0–0 | Four-Seam Fastball | 95.6 | Ball | Strikeout | 2449 | 6.61 | 20.0 | 6.8 | -0.355 | 3.656 | Not recorded | |
| 4 | Petey Halpin | 1–0 | Four-Seam Fastball | 95.5 | Swinging Strike | Strikeout | 2507 | 6.48 | 19.8 | 4.4 | 0.176 | 3.887 | Not recorded | |
| 4 | Petey Halpin | 1–1 | Cutter | 88.9 | Foul | Strikeout | 2657 | 6.68 | 3.0 | -3.4 | 0.629 | 1.774 | Not recorded | |
| 4 | Petey Halpin | 1–2 | Sinker | 95.8 | Called Strike | Strikeout | 2343 | 6.56 | 12.4 | 16.2 | 0.601 | 2.689 | Not recorded | |
| 5 | Brayan Rocchio | 0–0 | Curveball | 80.3 | Ball | Strikeout | 2485 | 6.47 | -13.6 | -4.4 | -0.003 | 0.329 | Not recorded | |
| 5 | Brayan Rocchio | 1–0 | Cutter | 89.8 | Foul | Strikeout | 2685 | 6.38 | 5.4 | -4.7 | 0.093 | 1.745 | Not recorded | |
| 5 | Brayan Rocchio | 1–1 | Cutter | 88.2 | Called Strike | Strikeout | 2864 | 6.31 | 0.2 | -5.2 | -0.674 | 2.486 | Not recorded | |
| 5 | Brayan Rocchio | 1–2 | Changeup | 89.7 | Swinging Strike | Strikeout | 1235 | 6.40 | 4.4 | 9.1 | -0.949 | 1.463 | Not recorded | |
| 5 | Steven Kwan | 0–0 | Four-Seam Fastball | 96.3 | Ball | Flyout | 2520 | 6.55 | 19.4 | 1.9 | -0.018 | 1.237 | Not recorded | |
| 5 | Steven Kwan | 1–0 | Four-Seam Fastball | 94.4 | Foul | Flyout | 2457 | 6.56 | 17.6 | 4.2 | -0.307 | 3.143 | Not recorded | |
| 5 | Steven Kwan | 1–1 | Sinker | 94.7 | Ball | Flyout | 2381 | 6.46 | 11.3 | 19.0 | 0.270 | 1.394 | Not recorded | |
| 5 | Steven Kwan | 2–1 | Cutter | 90.1 | In play, out(s) | Flyout | 2626 | 6.39 | 6.4 | -3.4 | 0.470 | 1.554 | 94.5 | |
| 5 | José Ramírez | 0–0 | Four-Seam Fastball | 96.1 | Called Strike | Strikeout | 2514 | 6.56 | 19.4 | 3.5 | -0.242 | 3.222 | Not recorded | |
| 5 | José Ramírez | 0–1 | Sinker | 94.9 | Called Strike | Strikeout | 2437 | 6.44 | 12.7 | 16.7 | 0.459 | 2.697 | Not recorded | |
| 5 | José Ramírez | 0–2 | Curveball | 84.2 | Ball | Strikeout | 2687 | 6.47 | -7.1 | -2.2 | -0.037 | 1.054 | Not recorded | |
| 5 | José Ramírez | 1–2 | Four-Seam Fastball | 96.6 | Swinging Strike | Strikeout | 2553 | 6.42 | 21.0 | 2.0 | 0.063 | 4.003 | Not recorded | |
| 6 | Chase DeLauter | 0–0 | Four-Seam Fastball | 94.1 | In play, run(s) | Home Run | 2384 | 6.54 | 19.2 | 7.0 | -0.464 | 2.956 | 102.3 | |
| 6 | Jo Adell | 0–0 | Sinker | 93.5 | Ball | Strikeout | 2352 | 6.41 | 13.4 | 18.0 | -0.730 | 3.534 | Not recorded | |
| 6 | Jo Adell | 1–0 | Cutter | 87.6 | Swinging Strike | Strikeout | 2676 | 6.39 | 1.7 | -5.5 | 0.739 | 1.111 | Not recorded | |
| 6 | Jo Adell | 1–1 | Cutter | 87.9 | Ball | Strikeout | 2668 | 6.37 | -2.2 | -3.2 | 0.719 | 0.872 | Not recorded | |
| 6 | Jo Adell | 2–1 | Sinker | 94.4 | Foul | Strikeout | 2244 | 6.43 | 12.2 | 16.1 | -1.107 | 3.748 | Not recorded | |
| 6 | Jo Adell | 2–2 | Four-Seam Fastball | 95.3 | Called Strike | Strikeout | 2432 | 6.68 | 19.9 | 4.3 | 0.648 | 2.030 | Not recorded | |
| 6 | Nathaniel Lowe | 0–0 | Four-Seam Fastball | 94.9 | Foul | Groundout | 2495 | 6.37 | 21.2 | 0.6 | 0.731 | 2.023 | Not recorded | |
| 6 | Nathaniel Lowe | 0–1 | Cutter | 89.5 | In play, out(s) | Groundout | 2622 | 6.48 | 4.8 | -6.8 | 0.805 | 1.808 | 104.4 | |
| 6 | Travis Bazzana | 0–0 | Four-Seam Fastball | 94.2 | Foul | Groundout | 2475 | 6.97 | 20.8 | -0.7 | 0.844 | 1.824 | Not recorded | |
| 6 | Travis Bazzana | 0–1 | Cutter | 86.5 | In play, out(s) | Groundout | 2507 | 6.65 | -2.5 | -3.1 | -0.761 | 2.187 | 74.5 | |
| 7 | Patrick Bailey | 0–0 | Cutter | 90.4 | In play, run(s) | Home Run | 2517 | 6.33 | 8.2 | -5.3 | 0.214 | 2.732 | 105.3 |
Sources, definitions and limitations
The official MLB final box score supplies the line. MLB’s final pitch feed for game 849820 supplies every Game 1 pitch, its call and recorded tracking measurements. All 91 physical pitches reconcile to the official count, with unique pitch IDs. There are 25 batters faced and 18 recorded outs. The source was retrieved October 13 UTC, still October 12 in Edmonton. Baseball innings notation uses .1 for one out and .2 for two outs.
The comparison uses 2596 pitches from 29 reconciled regular-season starter appearances for Tampa Bay Rays, 2026-03-26 through 2026-09-22. Postseason work, other clubs and other roles are excluded. Each included start’s physical pitch count matches its official appearance log. The April 18 start, game 823394, is excluded because 63 public pitch events do not reconcile to its 64-pitch official line. Official regular-season appearance log.
A miss rate divides swinging strikes, blocked swinging strikes, caught foul tips and missed bunts by all physical swing attempts. Fouls, bunts and balls in play enter the swing denominator. Both samples use the same definition. Called-strike-plus-whiff rate divides called strikes plus those misses by all physical pitches. Completed strikeouts remain a separate plate-appearance result. Chase divides swings at balls whose centers crossed outside a 17-inch-wide rectangle and the recorded batter-specific vertical boundaries by all located pitches outside that rectangle. MLB’s separate zone flag is retained in the data; it does not replace the geometric definition.
Speed is mph, spin rpm, extension feet, and MLB horizontal and induced vertical break are inches. Plate and release coordinates are feet. Pitch classifications and movement values retain MLB’s source fields. The data does not independently verify grip, target or the cause of a change. Release speed, spin, extension, movement and plate-location measurements are present for every outing pitch. All 18 balls in play have exit speed. Hard-hit means at least 95 mph. Expected batting average and expected weighted on-base average were not supplied by this source and remain blank in the files and unavailable in the explorer. No missing model estimate is invented.
Sources and notes
- Official MLB final game 849820 and matched regular-season starter pitch feeds. Full methods and declared comparison period are in the article.