
Business of Sports · NFL · RATINGS
NFL TV Ratings: What the CBS–Prime Video Audience Gap Shows
CBS’s Sunday window drew about 62% more average viewers than Thursday Night Football in Week 6. Different games, dates and distribution shape what that difference establishes.
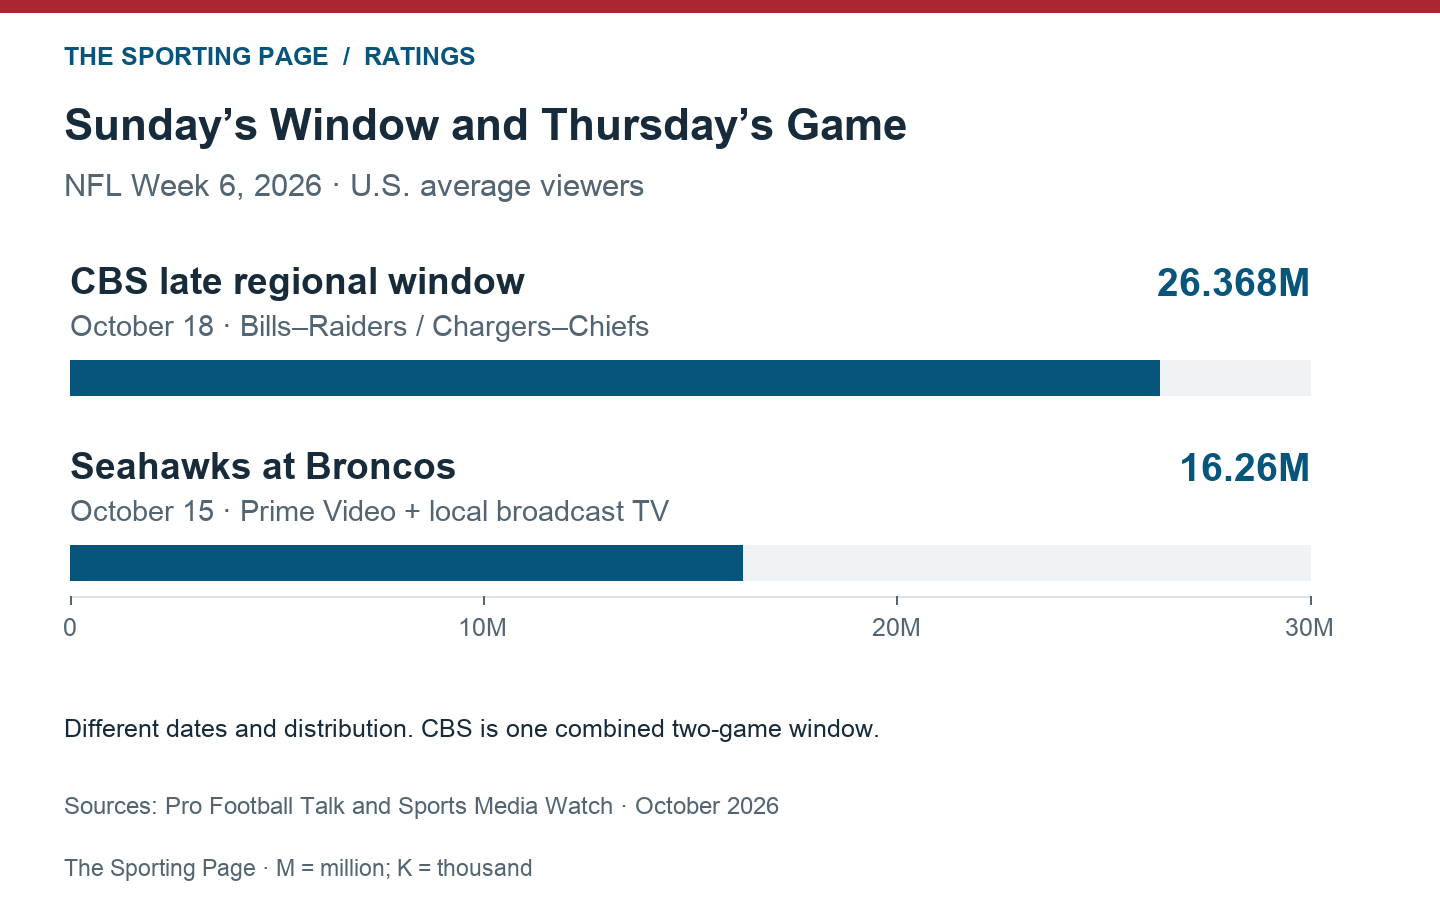
CBS’s late Sunday NFL window drew about 62% more average viewers than Thursday Night Football in Week 6. That is a substantial audience gap, but the comparison puts two regional games against one national matchup, three days apart.
The 62% is a comparison between these broadcasts, not a year-over-year growth rate. The difference was 10.108 million viewers. CBS’s 26.368 million average was reported by Pro Football Talk. Sports Media Watch reported 16.26 million for Seattle at Denver, including Prime Video and local over-the-air simulcasts.
| Broadcast | Air Date | Average | Measurement Scope |
|---|---|---|---|
| CBS Late Window: Bills–Raiders / Chargers–Chiefs | October 18, 2026 | 26.368M | One network-window audience across the regional games; no individual-game split reported. |
| Seahawks at Broncos | October 15, 2026 | 16.26M | Prime Video plus local over-the-air simulcasts; one game. |
Two Games Behind One Audience
The Sunday figure belongs to CBS’s combined window. It cannot be assigned in full to Buffalo–Las Vegas or Los Angeles–Kansas City. Nor can it be divided equally between the games to estimate separate audiences. A market-by-market split would be needed to establish how much viewing each matchup contributed.
The games offered different experiences. Buffalo beat Las Vegas 33–30, while Kansas City defeated the Chargers 22–6. The close finish in one market and wider margin in another matter when assessing the product viewers received. Without separate game audiences or a minute-by-minute breakdown, neither result explains the size of the combined figure.
CBS also offered streaming access. Its 2026 coverage announcement says its games air on the network and stream in the local market on Paramount+. Availability does not establish which platforms a published audience includes. The reported Sunday measurement does not provide that breakout.
Thursday’s Smaller Audience Still Grew
Prime Video’s result has a more useful comparison within its own schedule. Sports Media Watch reported a 1% increase over last season’s corresponding Week 6 game, Eagles–Giants. A lower audience than Sunday’s network window therefore coexisted with growth over the comparable Thursday edition.
Denver won 17–14 after a Thursday kickoff at 6:15 p.m. MDT. Its audience also included local broadcast viewers, so describing every person counted as a Prime streaming viewer would overstate the platform-specific evidence. The report does not isolate those groups.
What the Gap Establishes
The comparison shows the scale of two NFL viewing occasions. It does not measure how many viewers would follow the same game from CBS to Prime, or the effect of moving football behind a subscription. Teams, dates, kickoff times and the number of games changed alongside distribution.
Those differences also limit the business conclusion. Average viewers alone do not reveal subscription additions, advertising revenue, rights costs or profit. The Sunday window delivered the larger reported audience; Thursday’s result grew within its own annual comparison. Both findings belong in the assessment.
Sources and Method: Audience reports are linked above. The gap is calculated as 26.368 minus 16.26 million; the percentage divides that difference by 16.26 million and rounds to the nearest whole percent. Figures are averages, not peaks or unique viewers. The table preserves the reported distribution scopes. Explore the NFL Ratings Records.