

Business of Sports · College Sports · RATINGS
College Football TV Ratings: Ohio State–Indiana Tops Notre Dame–BYU
The October 17 game averages put FOX’s early matchup ahead of ABC’s primetime broadcast. Different start times shape what that comparison establishes.
Ohio State–Indiana averaged 10.376 million viewers on FOX. Notre Dame–BYU followed at 9.2 million on ABC on the same October 17 college football Saturday, putting the two top-10 matchups ahead of Alabama–Tennessee’s 8.1 million.
The difference between the first two broadcasts was about 1.18 million viewers, or 13% of the Notre Dame–BYU audience. That is a comparison of reported game averages. It does not establish how many viewers chose one matchup over the other, because the games started seven and a half hours apart.
| Game | Network | Start, MDT | Average viewers |
|---|---|---|---|
| Ohio State at Indiana | FOX | 10 a.m. | 10.376 million |
| Notre Dame at BYU | ABC | 5:30 p.m. | 9.2 million |
| Alabama at Tennessee | ABC | 1:30 p.m. | 8.1 million |
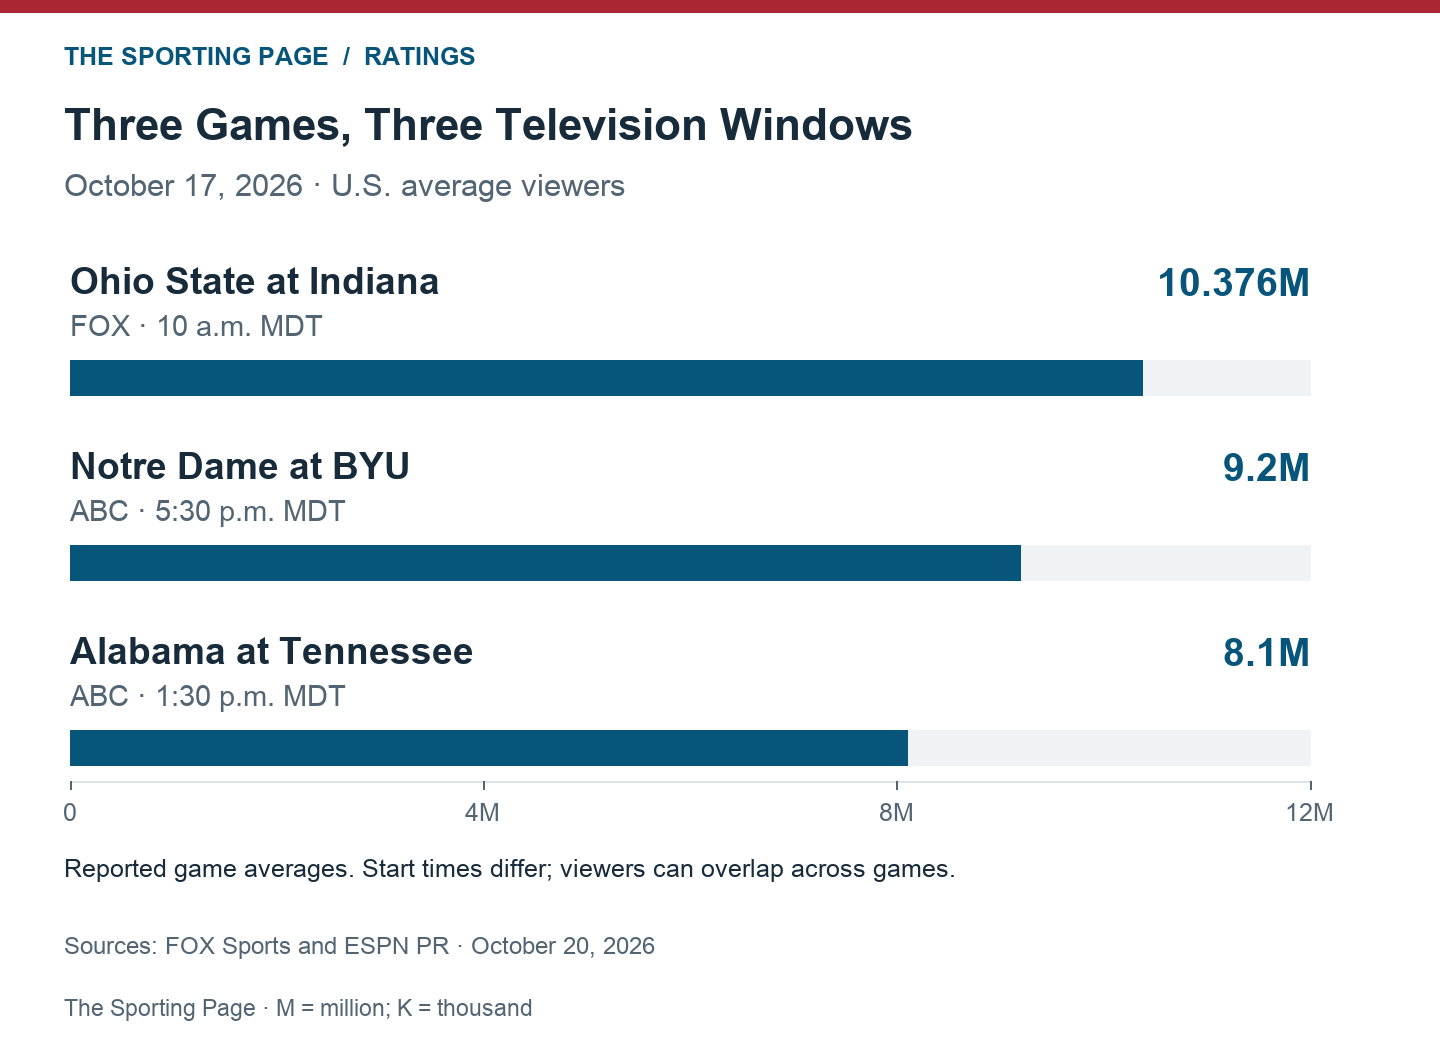
Three audiences, three television windows
The schedule gave these matchups different places in the day. Ohio State visited Indiana in the early window. Alabama–Tennessee occupied ABC’s afternoon slot before Notre Dame–BYU took the network’s primetime position. The latter two were consecutive parts of ABC’s announced lineup, rather than simultaneous alternatives.
That arrangement helps define what the comparison can answer. The numbers show how the three broadcasts performed in their assigned slots. They cannot measure a direct audience choice between FOX and ABC, or isolate the effect of a particular team. A viewer could contribute to the audience for all three, so the rows can include the same people.
Notre Dame–BYU also outdrew Alabama–Tennessee by about 1.1 million, roughly 14%, on the same network. That keeps the broadcaster constant, but changes the time, opponents and game. It is a useful comparison of ABC’s Saturday audiences without being a controlled test of Big 12 or SEC interest.
The games supplied different contests
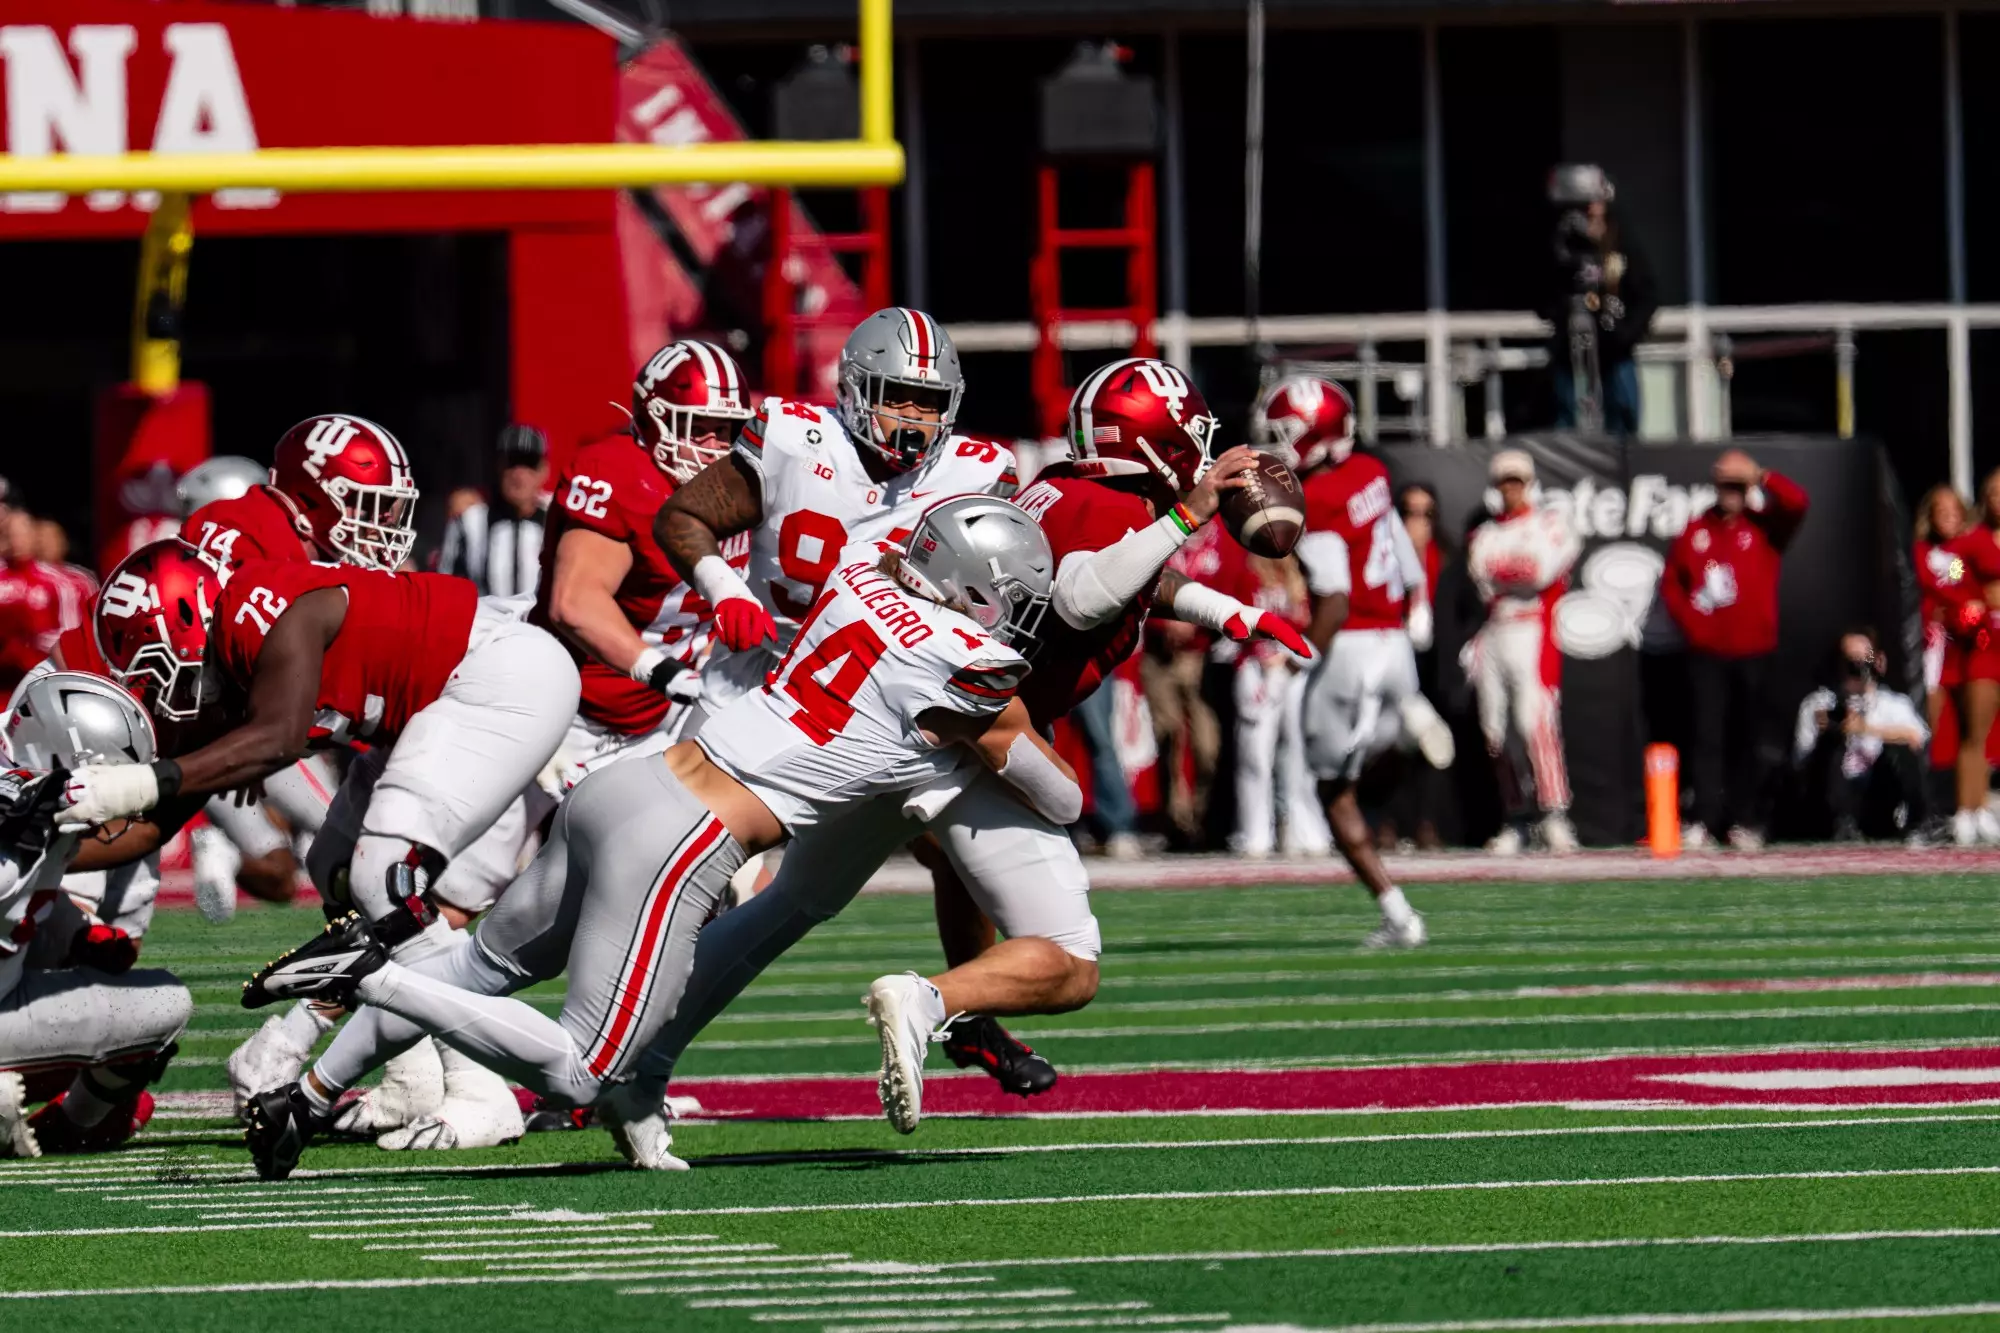
The two larger audiences accompanied close games. Ohio State won 19–15 in Bloomington in a matchup between teams ranked fourth and fifth in the AP poll. BYU beat Notre Dame 28–24 in Provo after entering the game eighth against the second-ranked Fighting Irish.
Tennessee’s 26–10 victory over Alabama developed differently. The Volunteers led 12–10 at halftime and scored the second half’s only points. The three final margins describe the contests being televised; the available full-game averages do not show how many people arrived or left as those scores changed.
That distinction matters before crediting a close finish for an audience gain. Demonstrating that connection would require comparable viewing figures across the games’ progress. A final score and a full-game average alone cannot identify what held viewers’ attention.
These are averages, so adding the rows would not produce a count of different people who watched college football that Saturday. The table selects three prominent matchups and preserves their individual dates and networks. It is not a complete weekly audience ranking or a measure of how many fans each program has.
Explore the college sports records in the Ratings database for the reported figures and source details.
Sources and notes
Audience reports: FOX Sports and ESPN PR, October 20. ESPN’s averages are rounded to one decimal place in millions; the reported values retain that precision. Start times come from the announced schedules and are shown in Mountain Daylight Time. Peak audiences are excluded.
More from The Sporting Page
 Business of Sports
ATP Prize Money, Bonuses and Profit Sharing: How the Payments Differ
 Business of Sports
Wimbledon’s £64.2 Million Prize Pot: Where the Money Went in 2026
 Business of Sports