
MLB · Pitching Data
Kannon Kemp Hits 99.3 MPH in Four Hitless Arizona Fall League Innings
Kemp’s 58-pitch AFL outing combined high velocity, misses and soft contact, with two walks and a longer early workload.
Kannon Kemp’s four hitless innings on October 17 paired a 99.3 mph fastball maximum with nine misses on 22 swings. The complete 58-pitch record shows why the result involved more than his hardest pitch: seven balls put in play all stayed below 95 mph.
The Peoria right-hander struck out five Scottsdale hitters and walked two. His four-seamer accounted for 21 pitches, 36.2% of the total, with 16 sinkers, 15 sliders, five changeups and one sweeper. The two fastball classifications together represented 63.8% of the outing.
His four-seamer averaged 97.2 mph. The 99.3 reading came in the second inning, when that classification averaged 97.4 across eight pitches. The fourth-inning average was 97.7 on four pitches. Those are small samples, but the inning sequence does not show a steady loss of four-seam speed.
The scoreless line also required work around his control. Kemp threw 26 balls among the 58 physical pitches, issued two walks and had a wild pitch. The first two innings required 35 pitches; the final two took 23. Hitless did not mean every count was comfortable.
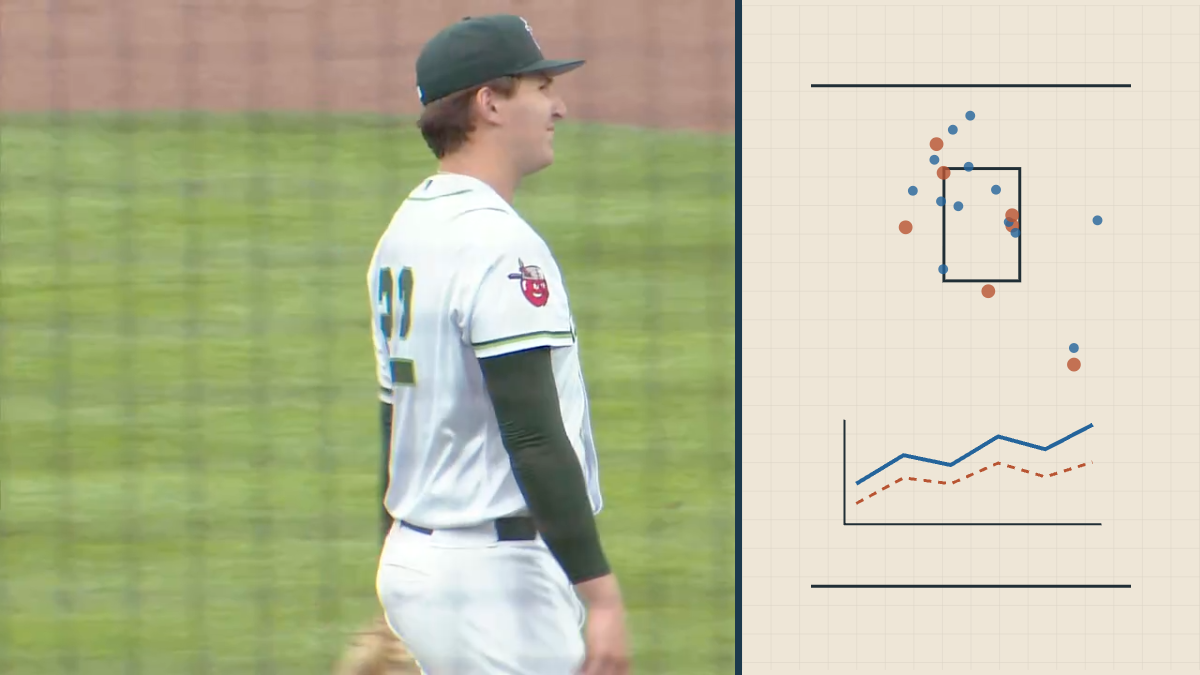
Jett Williams’ third-inning strikeout illustrates that workload. Kemp used eight pitches, moving between sinkers, sliders and a changeup. Williams fouled three consecutive full-count pitches before a 96.0 mph sinker produced a caught foul tip for strike three. That foul tip is included among misses under the stated event definition.
Across the outing, Kemp’s nine misses in 22 swings produced a 40.9% rate. His previous AFL start, October 10, yielded five misses in 19 swings, or 26.3%, across 38 physical pitches. That comparison is limited to recorded calls and outcomes: the earlier game has no usable tracking measurements, so it cannot establish a velocity gain or repertoire change.
The contact in the October 17 outing was also favorable. All seven balls put in play had measured exit speeds, averaging 81.0 mph; the hardest was 92.9. A seven-ball sample does not establish a lasting ability to suppress hard contact, but it does describe a different route to outs from strikeouts alone.
The current outing therefore supplies a concrete combination of speed, misses and soft contact. The complete pitch record preserves the walks and extended counts alongside those strengths, with the missing measurements from the comparison start left unavailable.
Current outing pitch selection
Four-seam fastball: 36.2% (21 pitches)
Sinker: 27.6% (16 pitches)
Slider: 25.9% (15 pitches)
Changeup: 8.6% (5 pitches)
Sweeper: 1.7% (1 pitch)
Four-seam inning sample sizes: inning 1: 7, inning 2: 8, inning 3: 2, inning 4: 4. Velocity and workload use separate axes; they do not establish causation.
A revealing plate appearance
- Sinker, 96.4 mph; 0–0; Ball
- Slider, 88.6 mph; 1–0; Called Strike
- Slider, 87.1 mph; 1–1; Ball
- Sinker, 97.1 mph; 2–1; Foul
- Changeup, 90.1 mph; 2–2; Ball
- Slider, 87.6 mph; 3–2; Foul
- Sinker, 96.3 mph; 3–2; Foul
- Sinker, 96.0 mph; 3–2; Foul Tip
The rectangle uses the first pitch’s recorded strike-zone bounds. Individual bounds remain in the ledger. Numbered markers preserve exact centers and may overlap.
Sources and method
The target ledger contains all 58 physical pitches from Baseball Savant’s gamefeed, matched by play ID, sequence, classification and pre-pitch count to the official final MLB record. Counts reconcile with official pitches, batters faced and strikeouts. Automatic calls and other nonpitch actions are excluded. Innings are calculated from outs.
The comparison is Kemp’s complete October 10 AFL start, game 867705: 38 physical pitches and 13 batters. Both official sequence and box score reconcile. It has no recorded pitch classifications, speeds, movement or contact measurements. Only observed calls, swing counts and official outcomes are comparable; no season baseline or velocity increase is asserted. All physical pitches remain in pitch-share denominators, including unclassified ones. Swinging strikes, blocked swinging strikes, foul tips and missed bunts count as misses; swings also include fouls and balls put in play. Hard contact is at least 95 mph on measured balls in play. Missing measurements remain unavailable.
The target pitch classifications and velocities are complete. All 38 pitches in the October 10 comparison lack speed, spin, extension, movement and pitch-location measurements, so those fields cannot support a between-start comparison. Different opponents, small inning samples and game situations limit comparisons.
Complete pitch explorer
58 pitches
Download the complete pitch ledger (CSV)
| Date | Inning | Pitch | Hitter | Balls before | Strikes before | Type | mph | Call | rpm | Extension ft | IVB in | Horizontal in | Plate x ft | Plate z ft | Zone bottom ft | Zone top ft | Exit mph | Launch deg |
|---|---|---|---|---|---|---|---|---|---|---|---|---|---|---|---|---|---|---|
| 2026-10-17 | 1 | 1 | Jett Williams | 0 | 0 | FF | 97.2 | Ball | 2222.0 | 6.273 | 12.8 | 2.6 | -0.679 | 3.553 | 1.502 | 2.977 | Unavailable | Unavailable |
| 2026-10-17 | 1 | 2 | Jett Williams | 1 | 0 | FF | 96.6 | Foul | 2172.0 | 6.337 | 13.9 | 5.8 | 0.565 | 2.338 | 1.502 | 2.977 | Unavailable | Unavailable |
| 2026-10-17 | 1 | 3 | Jett Williams | 1 | 1 | SI | 98.4 | Ball | 2198.0 | 6.269 | 4.6 | 10.4 | 0.275 | 1.312 | 1.502 | 2.977 | Unavailable | Unavailable |
| 2026-10-17 | 1 | 4 | Jett Williams | 2 | 1 | FF | 97.4 | Ball | 2162.0 | 6.219 | 12.6 | 0.8 | 0.087 | 4.084 | 1.502 | 2.977 | Unavailable | Unavailable |
| 2026-10-17 | 1 | 5 | Jett Williams | 3 | 1 | SI | 96.6 | Called Strike | 2139.0 | 6.247 | 4.1 | 9.7 | 0.258 | 3.127 | 1.502 | 2.977 | Unavailable | Unavailable |
| 2026-10-17 | 1 | 6 | Jett Williams | 3 | 2 | SI | 97.6 | Ball | 2170.0 | 6.308 | 4.7 | 12.4 | 0.082 | 3.189 | 1.502 | 2.977 | Unavailable | Unavailable |
| 2026-10-17 | 1 | 7 | Nathan Flewelling | 0 | 0 | FF | 95.9 | In play, out(s) | 2132.0 | 6.297 | 13.0 | 2.4 | 0.459 | 2.881 | 1.665 | 3.299 | 82.0 | 29.0 |
| 2026-10-17 | 1 | 8 | Zyhir Hope | 0 | 0 | SL | 88.9 | Ball In Dirt | 2550.0 | 6.438 | 1.6 | -4.7 | 1.042 | 0.344 | 1.579 | 3.13 | Unavailable | Unavailable |
| 2026-10-17 | 1 | 9 | Zyhir Hope | 1 | 0 | FF | 97.8 | Swinging Strike | 2312.0 | 6.455 | 11.5 | 7.9 | -0.407 | 2.841 | 1.579 | 3.13 | Unavailable | Unavailable |
| 2026-10-17 | 1 | 10 | Zyhir Hope | 1 | 1 | FF | 96.6 | Ball | 2259.0 | 6.321 | 12.5 | 2.4 | -0.573 | 3.641 | 1.579 | 3.13 | Unavailable | Unavailable |
| 2026-10-17 | 1 | 11 | Zyhir Hope | 2 | 1 | SL | 88.3 | Ball | 2592.0 | 6.414 | 2.6 | -3.0 | 2.03 | 1.467 | 1.579 | 3.13 | Unavailable | Unavailable |
| 2026-10-17 | 1 | 12 | Zyhir Hope | 3 | 1 | FF | 97.3 | In play, out(s) | 2232.0 | 6.379 | 11.2 | 2.5 | 0.654 | 2.219 | 1.579 | 3.13 | 69.5 | 59.0 |
| 2026-10-17 | 1 | 13 | Nehomar Ochoa Jr. | 0 | 0 | SL | 88.6 | Called Strike | 2615.0 | 6.322 | 0.8 | -5.3 | 0.221 | 2.084 | 1.71 | 3.388 | Unavailable | Unavailable |
| 2026-10-17 | 1 | 14 | Nehomar Ochoa Jr. | 0 | 1 | SI | 97.3 | In play, out(s) | 2268.0 | 6.314 | 6.2 | 9.7 | 0.049 | 2.674 | 1.71 | 3.388 | 90.0 | -29.0 |
| 2026-10-17 | 2 | 15 | John Peck | 0 | 0 | SI | 96.6 | Swinging Strike | 2128.0 | 6.23 | 4.9 | 12.6 | -0.536 | 3.275 | 1.61 | 3.191 | Unavailable | Unavailable |
| 2026-10-17 | 2 | 16 | John Peck | 0 | 1 | FF | 97.3 | Ball | 2363.0 | 6.355 | 14.2 | 2.8 | 0.261 | 4.118 | 1.61 | 3.191 | Unavailable | Unavailable |
| 2026-10-17 | 2 | 17 | John Peck | 1 | 1 | SI | 97.6 | Ball | 2311.0 | 6.274 | 6.0 | 10.3 | 0.792 | 3.911 | 1.61 | 3.191 | Unavailable | Unavailable |
| 2026-10-17 | 2 | 18 | John Peck | 2 | 1 | SL | 88.7 | Called Strike | 2598.0 | 6.239 | 3.7 | -3.6 | 0.046 | 2.14 | 1.61 | 3.191 | Unavailable | Unavailable |
| 2026-10-17 | 2 | 19 | John Peck | 2 | 2 | FF | 97.6 | Swinging Strike | 2368.0 | 6.279 | 14.4 | 1.0 | -0.562 | 3.637 | 1.61 | 3.191 | Unavailable | Unavailable |
| 2026-10-17 | 2 | 20 | Eric Bitonti | 0 | 0 | FF | 97.7 | Called Strike | 2446.0 | 6.344 | 14.2 | 6.2 | -0.182 | 3.159 | 1.739 | 3.446 | Unavailable | Unavailable |
| 2026-10-17 | 2 | 21 | Eric Bitonti | 0 | 1 | CH | 91.2 | Ball | 1975.0 | 6.311 | 9.6 | 15.6 | 0.428 | 1.197 | 1.739 | 3.446 | Unavailable | Unavailable |
| 2026-10-17 | 2 | 22 | Eric Bitonti | 1 | 1 | SL | 88.2 | Called Strike | 2682.0 | 6.4 | 1.2 | -5.6 | -0.054 | 2.181 | 1.739 | 3.446 | Unavailable | Unavailable |
| 2026-10-17 | 2 | 23 | Eric Bitonti | 1 | 2 | FF | 99.3 | Ball | 2409.0 | 6.381 | 14.5 | 3.1 | -1.256 | 3.445 | 1.739 | 3.446 | Unavailable | Unavailable |
| 2026-10-17 | 2 | 24 | Eric Bitonti | 2 | 2 | FF | 97.4 | Ball | 2351.0 | 6.375 | 14.9 | 4.8 | -1.468 | 3.206 | 1.739 | 3.446 | Unavailable | Unavailable |
| 2026-10-17 | 2 | 25 | Eric Bitonti | 3 | 2 | SL | 87.9 | Ball | 2621.0 | 6.154 | -1.1 | -5.0 | -0.059 | 1.343 | 1.739 | 3.446 | Unavailable | Unavailable |
| 2026-10-17 | 2 | 26 | Waner Luciano | 0 | 0 | SL | 88.1 | Ball In Dirt | 2581.0 | 6.362 | 4.4 | -5.6 | 0.05 | 0.034 | 1.643 | 3.255 | Unavailable | Unavailable |
| 2026-10-17 | 2 | 27 | Waner Luciano | 1 | 0 | SI | 96.6 | Called Strike | 2342.0 | 6.315 | 5.0 | 12.5 | 0.352 | 2.207 | 1.643 | 3.255 | Unavailable | Unavailable |
| 2026-10-17 | 2 | 28 | Waner Luciano | 1 | 1 | SI | 96.0 | Ball | 2330.0 | 6.594 | 8.0 | 12.7 | 1.412 | 2.511 | 1.643 | 3.255 | Unavailable | Unavailable |
| 2026-10-17 | 2 | 29 | Waner Luciano | 2 | 1 | FF | 96.4 | In play, out(s) | 2451.0 | 6.437 | 12.5 | 2.3 | 0.535 | 3.034 | 1.643 | 3.255 | 92.9 | 49.0 |
| 2026-10-17 | 2 | 30 | Luke Davis | 0 | 0 | FF | 97.0 | Called Strike | 2499.0 | 6.354 | 13.1 | 4.4 | 0.03 | 3.107 | 1.62 | 3.21 | Unavailable | Unavailable |
| 2026-10-17 | 2 | 31 | Luke Davis | 0 | 1 | FF | 96.3 | Foul | 2368.0 | 6.435 | 14.8 | 5.2 | -0.169 | 2.802 | 1.62 | 3.21 | Unavailable | Unavailable |
| 2026-10-17 | 2 | 32 | Luke Davis | 0 | 2 | SL | 87.8 | Ball | 2504.0 | 6.538 | 1.4 | -4.2 | -0.269 | 0.413 | 1.62 | 3.21 | Unavailable | Unavailable |
| 2026-10-17 | 2 | 33 | Luke Davis | 1 | 2 | CH | 91.1 | Ball In Dirt | 1984.0 | 6.506 | 3.4 | 15.2 | 1.351 | -0.064 | 1.62 | 3.21 | Unavailable | Unavailable |
| 2026-10-17 | 2 | 34 | Luke Davis | 2 | 2 | CH | 90.4 | Ball | 1911.0 | 6.402 | 5.6 | 16.3 | 0.707 | 0.856 | 1.62 | 3.21 | Unavailable | Unavailable |
| 2026-10-17 | 2 | 35 | Luke Davis | 3 | 2 | SL | 88.7 | Swinging Strike | 2585.0 | 6.341 | 4.7 | -4.7 | 0.227 | 1.56 | 1.62 | 3.21 | Unavailable | Unavailable |
| 2026-10-17 | 3 | 36 | Nick Monistere | 0 | 0 | SI | 95.1 | In play, out(s) | 2329.0 | 6.423 | 5.0 | 13.2 | -0.602 | 2.59 | 1.611 | 3.193 | 53.4 | 34.0 |
| 2026-10-17 | 3 | 37 | Jett Williams | 0 | 0 | SI | 96.4 | Ball | 2132.0 | 6.213 | 8.0 | 11.9 | -0.687 | 4.166 | 1.502 | 2.977 | Unavailable | Unavailable |
| 2026-10-17 | 3 | 38 | Jett Williams | 1 | 0 | SL | 88.6 | Called Strike | 2495.0 | 6.253 | 2.0 | -7.1 | 0.718 | 2.27 | 1.502 | 2.977 | Unavailable | Unavailable |
| 2026-10-17 | 3 | 39 | Jett Williams | 1 | 1 | SL | 87.1 | Ball | 2393.0 | 6.12 | 1.2 | -5.8 | 0.112 | 1.121 | 1.502 | 2.977 | Unavailable | Unavailable |
| 2026-10-17 | 3 | 40 | Jett Williams | 2 | 1 | SI | 97.1 | Foul | 2186.0 | 6.266 | 4.8 | 13.3 | -0.776 | 2.592 | 1.502 | 2.977 | Unavailable | Unavailable |
| 2026-10-17 | 3 | 41 | Jett Williams | 2 | 2 | CH | 90.1 | Ball | 1811.0 | 6.58 | 7.4 | 14.4 | 1.722 | 0.191 | 1.502 | 2.977 | Unavailable | Unavailable |
| 2026-10-17 | 3 | 42 | Jett Williams | 3 | 2 | SL | 87.6 | Foul | 2552.0 | 6.237 | 2.3 | -4.3 | 0.563 | 2.195 | 1.502 | 2.977 | Unavailable | Unavailable |
| 2026-10-17 | 3 | 43 | Jett Williams | 3 | 2 | SI | 96.3 | Foul | 2247.0 | 6.326 | 6.1 | 13.7 | -1.306 | 2.766 | 1.502 | 2.977 | Unavailable | Unavailable |
| 2026-10-17 | 3 | 44 | Jett Williams | 3 | 2 | SI | 96.0 | Foul Tip | 2351.0 | 6.377 | 6.2 | 13.7 | -0.451 | 2.513 | 1.502 | 2.977 | Unavailable | Unavailable |
| 2026-10-17 | 3 | 45 | Nathan Flewelling | 0 | 0 | SL | 88.1 | Ball | 2573.0 | 6.59 | 1.4 | -5.8 | 1.723 | -0.081 | 1.665 | 3.299 | Unavailable | Unavailable |
| 2026-10-17 | 3 | 46 | Nathan Flewelling | 1 | 0 | FF | 96.5 | Ball | 2371.0 | 6.615 | 15.4 | 2.8 | 2.165 | 2.282 | 1.665 | 3.299 | Unavailable | Unavailable |
| 2026-10-17 | 3 | 47 | Nathan Flewelling | 2 | 0 | FF | 95.6 | In play, out(s) | 2358.0 | 6.399 | 11.0 | 6.0 | 0.257 | 2.783 | 1.665 | 3.299 | 90.1 | 62.0 |
| 2026-10-17 | 4 | 48 | Zyhir Hope | 0 | 0 | SL | 86.0 | Called Strike | 2402.0 | 6.178 | 2.3 | -4.4 | -0.728 | 3.059 | 1.579 | 3.13 | Unavailable | Unavailable |
| 2026-10-17 | 4 | 49 | Zyhir Hope | 0 | 1 | CH | 88.5 | Foul | 1754.0 | 6.189 | 9.6 | 17.0 | -0.736 | 1.481 | 1.579 | 3.13 | Unavailable | Unavailable |
| 2026-10-17 | 4 | 50 | Zyhir Hope | 0 | 2 | FF | 97.3 | Ball | 2319.0 | 6.257 | 13.4 | 4.9 | -0.227 | 3.995 | 1.579 | 3.13 | Unavailable | Unavailable |
| 2026-10-17 | 4 | 51 | Zyhir Hope | 1 | 2 | FF | 98.2 | Ball | 2206.0 | 6.407 | 14.8 | 7.3 | -1.442 | 2.168 | 1.579 | 3.13 | Unavailable | Unavailable |
| 2026-10-17 | 4 | 52 | Zyhir Hope | 2 | 2 | SL | 88.2 | Swinging Strike | 2462.0 | 6.175 | 1.9 | -4.8 | -0.901 | 3.273 | 1.579 | 3.13 | Unavailable | Unavailable |
| 2026-10-17 | 4 | 53 | Nehomar Ochoa Jr. | 0 | 0 | SI | 96.7 | Called Strike | 2253.0 | 6.306 | 5.4 | 13.8 | 0.497 | 2.255 | 1.71 | 3.388 | Unavailable | Unavailable |
| 2026-10-17 | 4 | 54 | Nehomar Ochoa Jr. | 0 | 1 | SI | 95.7 | In play, out(s) | 2233.0 | 6.403 | 6.1 | 13.3 | 0.56 | 2.365 | 1.71 | 3.388 | 88.8 | 26.0 |
| 2026-10-17 | 4 | 55 | John Peck | 0 | 0 | ST | 81.7 | Ball | 2912.0 | 6.477 | 2.4 | -13.7 | -0.554 | 3.765 | 1.61 | 3.191 | Unavailable | Unavailable |
| 2026-10-17 | 4 | 56 | John Peck | 1 | 0 | FF | 97.5 | Swinging Strike | 2261.0 | 6.548 | 14.5 | 5.9 | 0.624 | 2.077 | 1.61 | 3.191 | Unavailable | Unavailable |
| 2026-10-17 | 4 | 57 | John Peck | 1 | 1 | SI | 96.0 | Foul Tip | 2216.0 | 6.224 | 5.9 | 12.1 | -0.861 | 3.529 | 1.61 | 3.191 | Unavailable | Unavailable |
| 2026-10-17 | 4 | 58 | John Peck | 1 | 2 | FF | 97.8 | Swinging Strike | 2224.0 | 6.485 | 15.8 | 5.9 | -0.257 | 3.158 | 1.61 | 3.191 | Unavailable | Unavailable |
Sources and notes
- MLB official final record: https://statsapi.mlb.com/api/v1.1/game/867693/feed/live
- Baseball Savant complete pitch data: https://baseballsavant.mlb.com/gf?game_pk=867693
- October 10 comparison tracking measurements are unavailable. Recorded pitch calls and outcomes remain available.